A/A test
A/A test is similar to A/B test but it compares two identical variations. While the goal of A/B testing is to find statistically significant results between control and treatment, A/A testing expects there is no statistically significant difference between the two groups and is conducted to confirm this expectation.
Why run an A/A test?
A/A test is often used before adopting a new test platform to evaluate its reliability and accuracy. Also, organizations can use A/A test to get additional information such as conversion rate baseline or minimum sample size, which can be used in future A/B testing.
New clients of Hackle run A/A testing to examine the reliability of our A/B testing platform.
Things to keep in mind with A/A testing
While running an A/A test, you can sometimes get unexpected results that there is a significant difference between control and treatment. However, it does not always suggest problems with the experiment implementation or the platform.
In hypothesis testing, statistical significance is probability. A 95% statistical significance level means there is a 1 in 20 chance that the A/A test results in a significant result (type I error). Therefore, if you confirm that the probability of getting a significant result is within the statistical significance, you can conclude that the result was due to chance.
Running hundreds thousands of A/A tests to get the probability of getting significant results is a waste of time. Instead, repeatedly redistribute users from one A/A test into two groups and calculate the p-value or bayesian probability distribution.
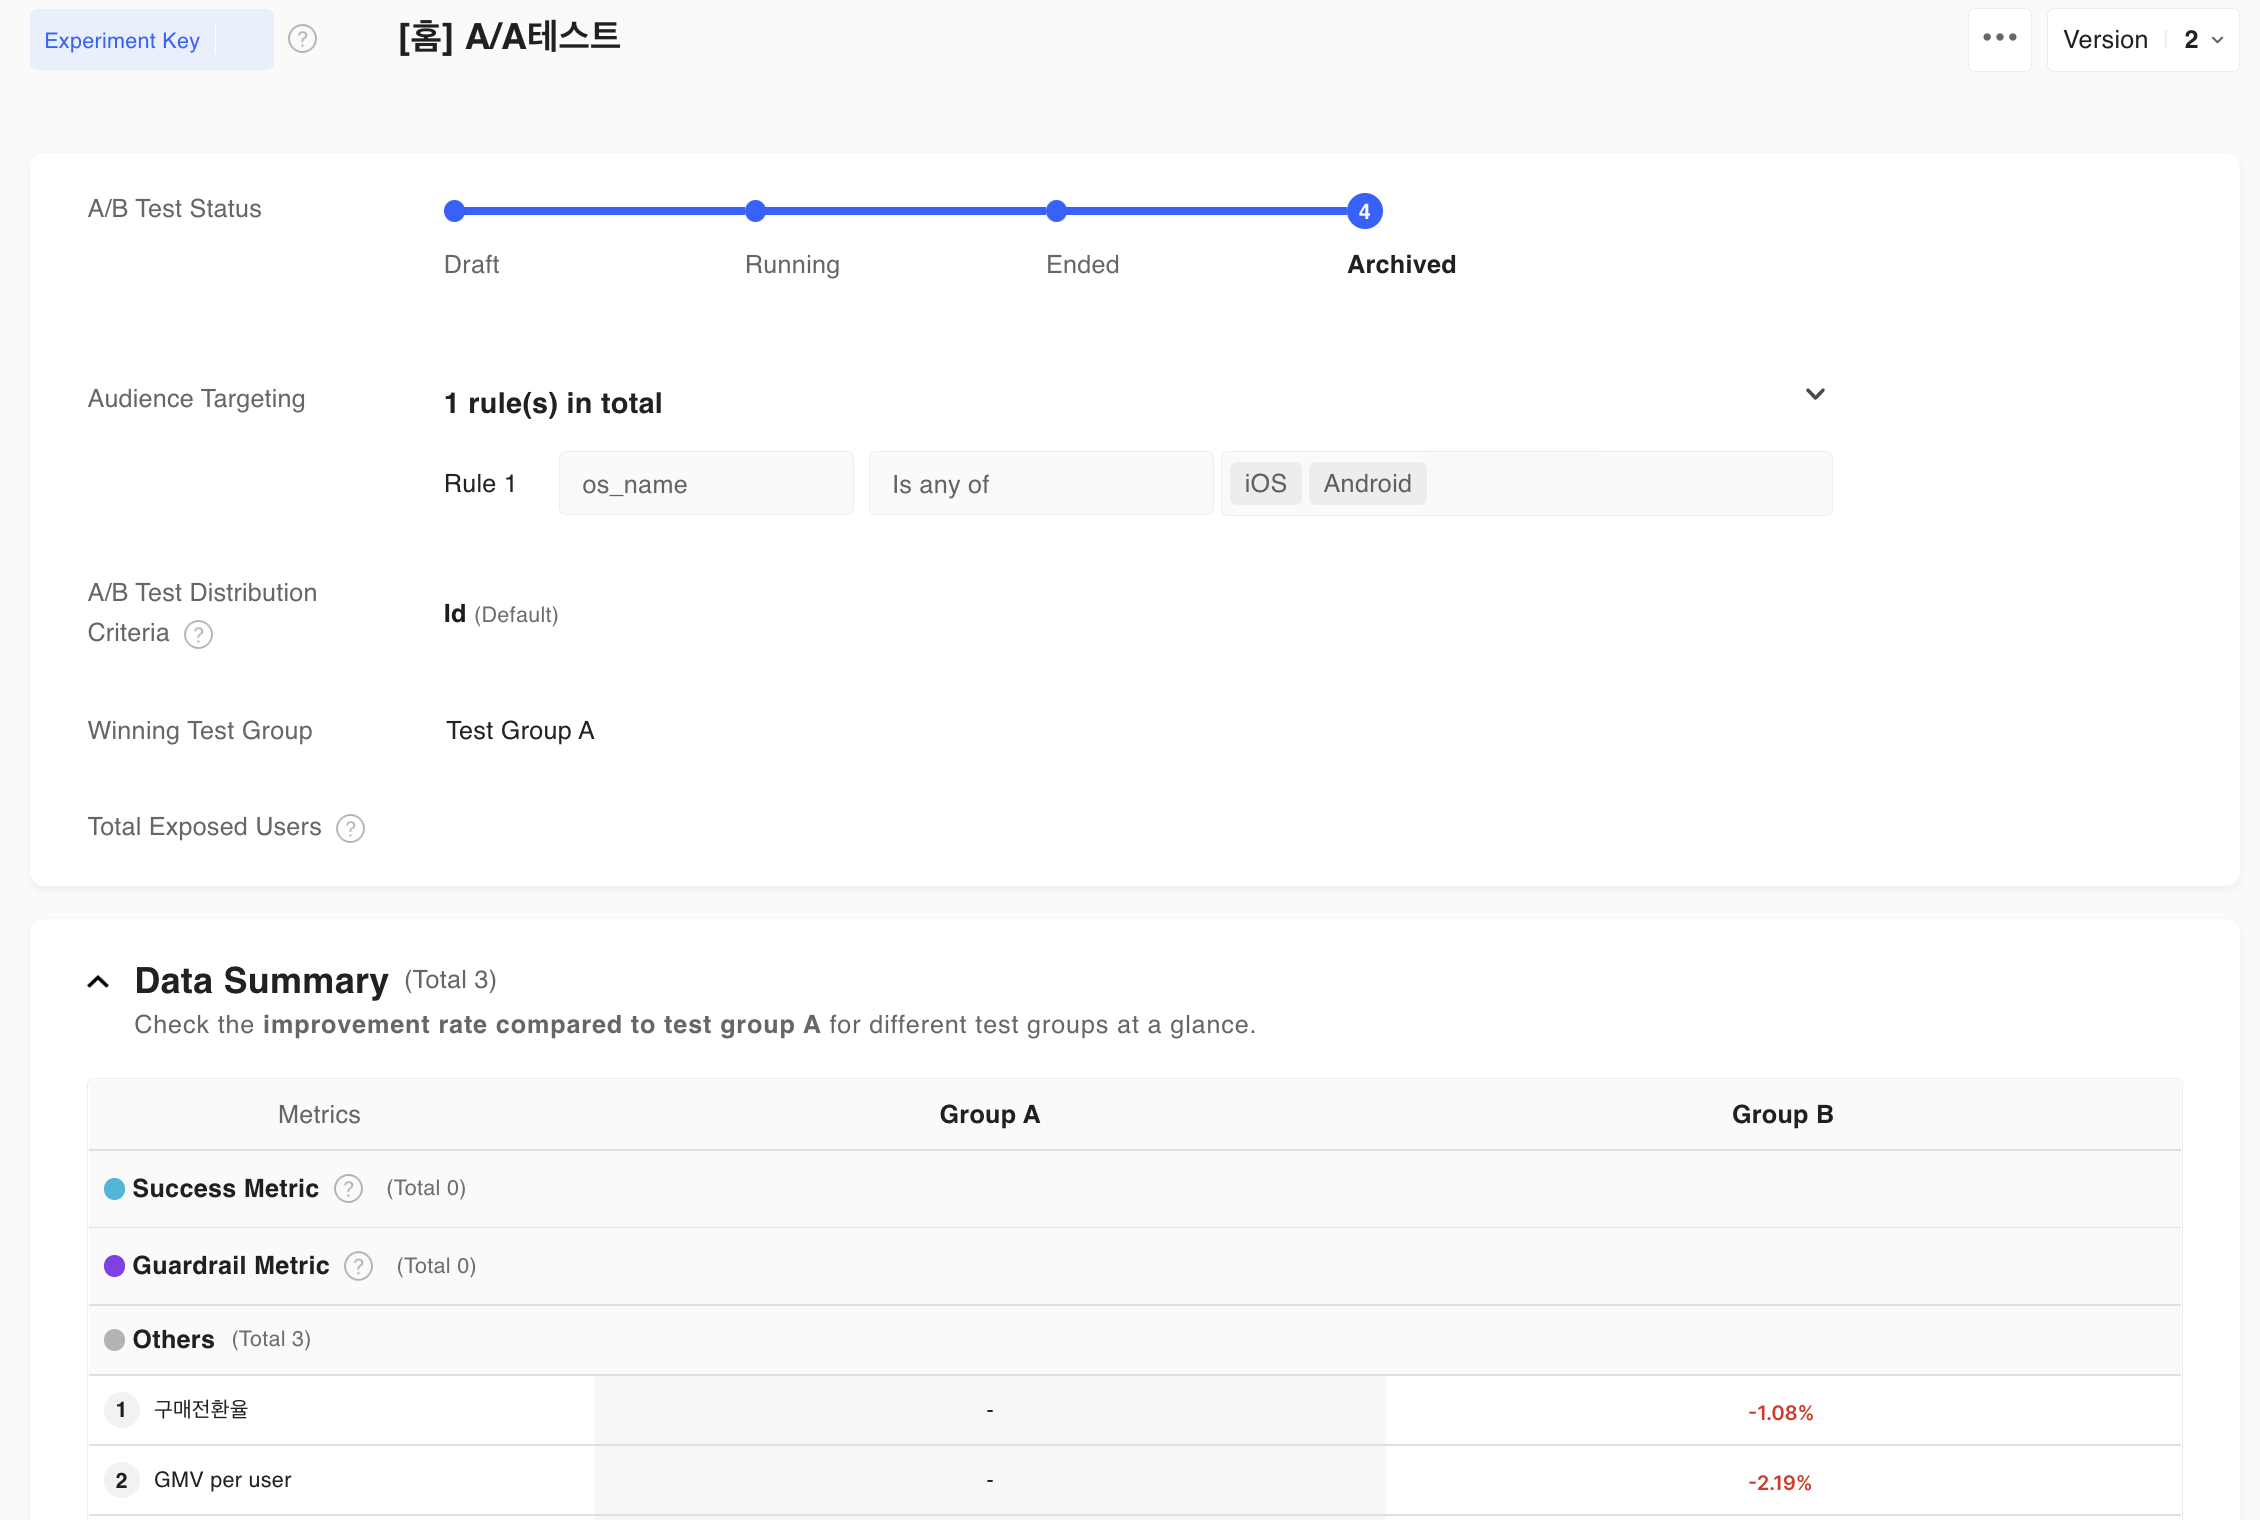
This is an actual A/A test result page from Hackle that resulted in the significant result.Let’s use this experiment data to resample users into two groups repeatedly and compare the conversion rate with a 95% significance level.
p-value distribution
Hypothesis testing rejects the null hypothesis(there is no difference between groups) when the p-value is smaller than the significance level.
Significance level is the probability of accepting the alternative hypothesis(there is a difference between groups) when the null hypothesis is true. According to this definition, the probability of having a p-value smaller than the significance level has to be significance level.

When the null hypothesis is true, test statistic T has the distribution F(t). Assuming F(⋅) is invertible we can say p-value P = F(T) follows a uniform distribution.
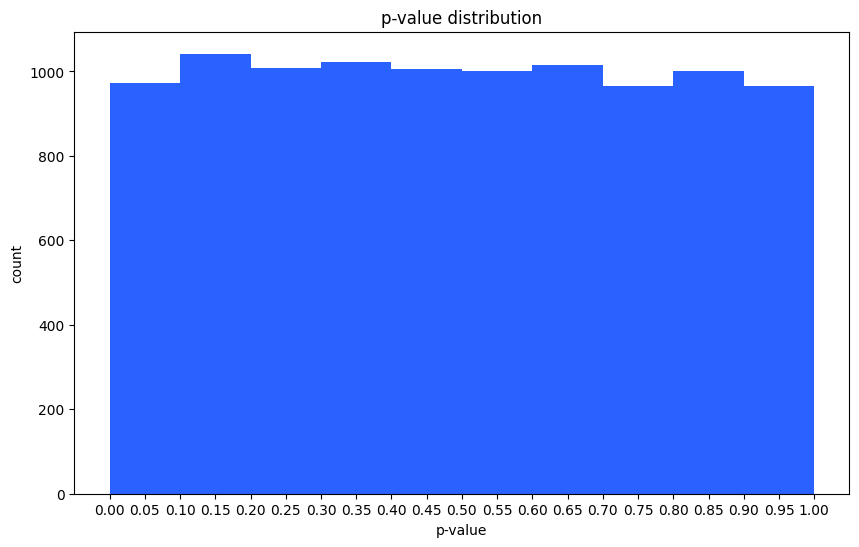
This is a p-value distribution histogram obtained from 10,000 simulations using actual A/A test data. A/A test resulted with significant difference between control and treatment, but p-value is distributed uniformly. This implies that the chance of getting this significant result is within the statistical significance.
Bayesian probability distribution
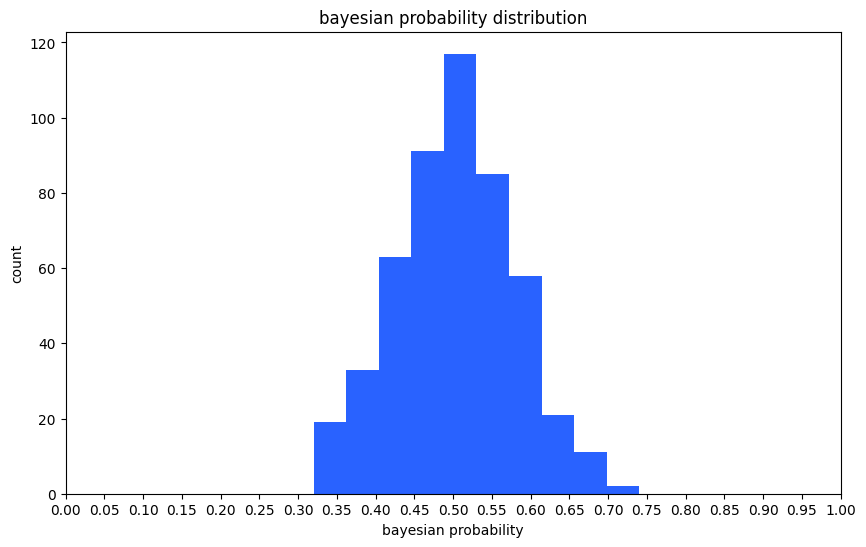
Bayesian A/B test estimates the control and treatment’s posterior distribution and calculates the probability of getting a higher objective in the treatment group. We did the bayesian simulation 500 times to draw a histogram. It shows that bayesian probability follows a bell-shaped distribution with an average of 0.5. If the probability of getting a higher conversion rate in treatment is close to 0.5, we can conclude that there is no significant difference between the two groups.
When p-value and bayesian probability has different distribution or the A/A test keeps resulting in significant result, there might be a problem with the test design or data itself.
Common reasons why A/A test fails are:
-
There are outliers in the data. → Hackle provides an outlier removing function Outliers .
-
Users who are not intended or are supposed to be included in the test are shown in the exposed data. → You can confirm that traffic distribution is working properly in Live Exposure Count. It shows whether the traffic distribution is held on the intended page and then the expose data is generated. Also, you can check whether only targeted users participate in the test.
-
Users are not evenly distributed. The number of users in control and treatment varies or users with certain properties are in the same group. → Hackle distributes users using a bucketing method with a hash function. As long as there is no problem with the experiment design, Hackle guarantees even distribution. Reference Traffic Distribution page for more detailed information.
Things to keep in mind with A/A/B testing
A/A/B test is used when you want to perform the A/A test and A/B test at the same time. Because A/A/B test distributes traffic into three groups(A, A, or B), the number of users in each group diminishes which results in lower test power. Hence, you should have larger traffic or run the test longer to have sufficient power in A/A/B test. This is why we recommend running A/A test instead of A/A/B test.
Updated 20 days ago