Step 2: Set Metrics
Metrics are what you measure in your A/B test. The impact of any type of changes you make on your digital product for an A/B test must be calculated via metrics.
For example, suppose a company is considering changing the color of a Purchase button on their app. They are making this color change because they want to induce users to click on the Purchase button more.
In this case, you can A/B test and experiment with different colors of the Purchase button to gauge which color is the best. So, how do you set your A/B test metrics?
You can set the 'number of purchase button clicks' or 'purchase conversion rate' as your metric, as making more clicks on the Purchase button ultimately increases your conversion rate.
You can set new metrics for each A/B test, or reuse previously registered metrics from other A/B tests.
New metrics can be added after the A/B test starts.You can set new metrics after "starting" your A/B test.
Select metrics
Click the Set Metrics button located at the top right of the Metrics tab on the A/B Test page.
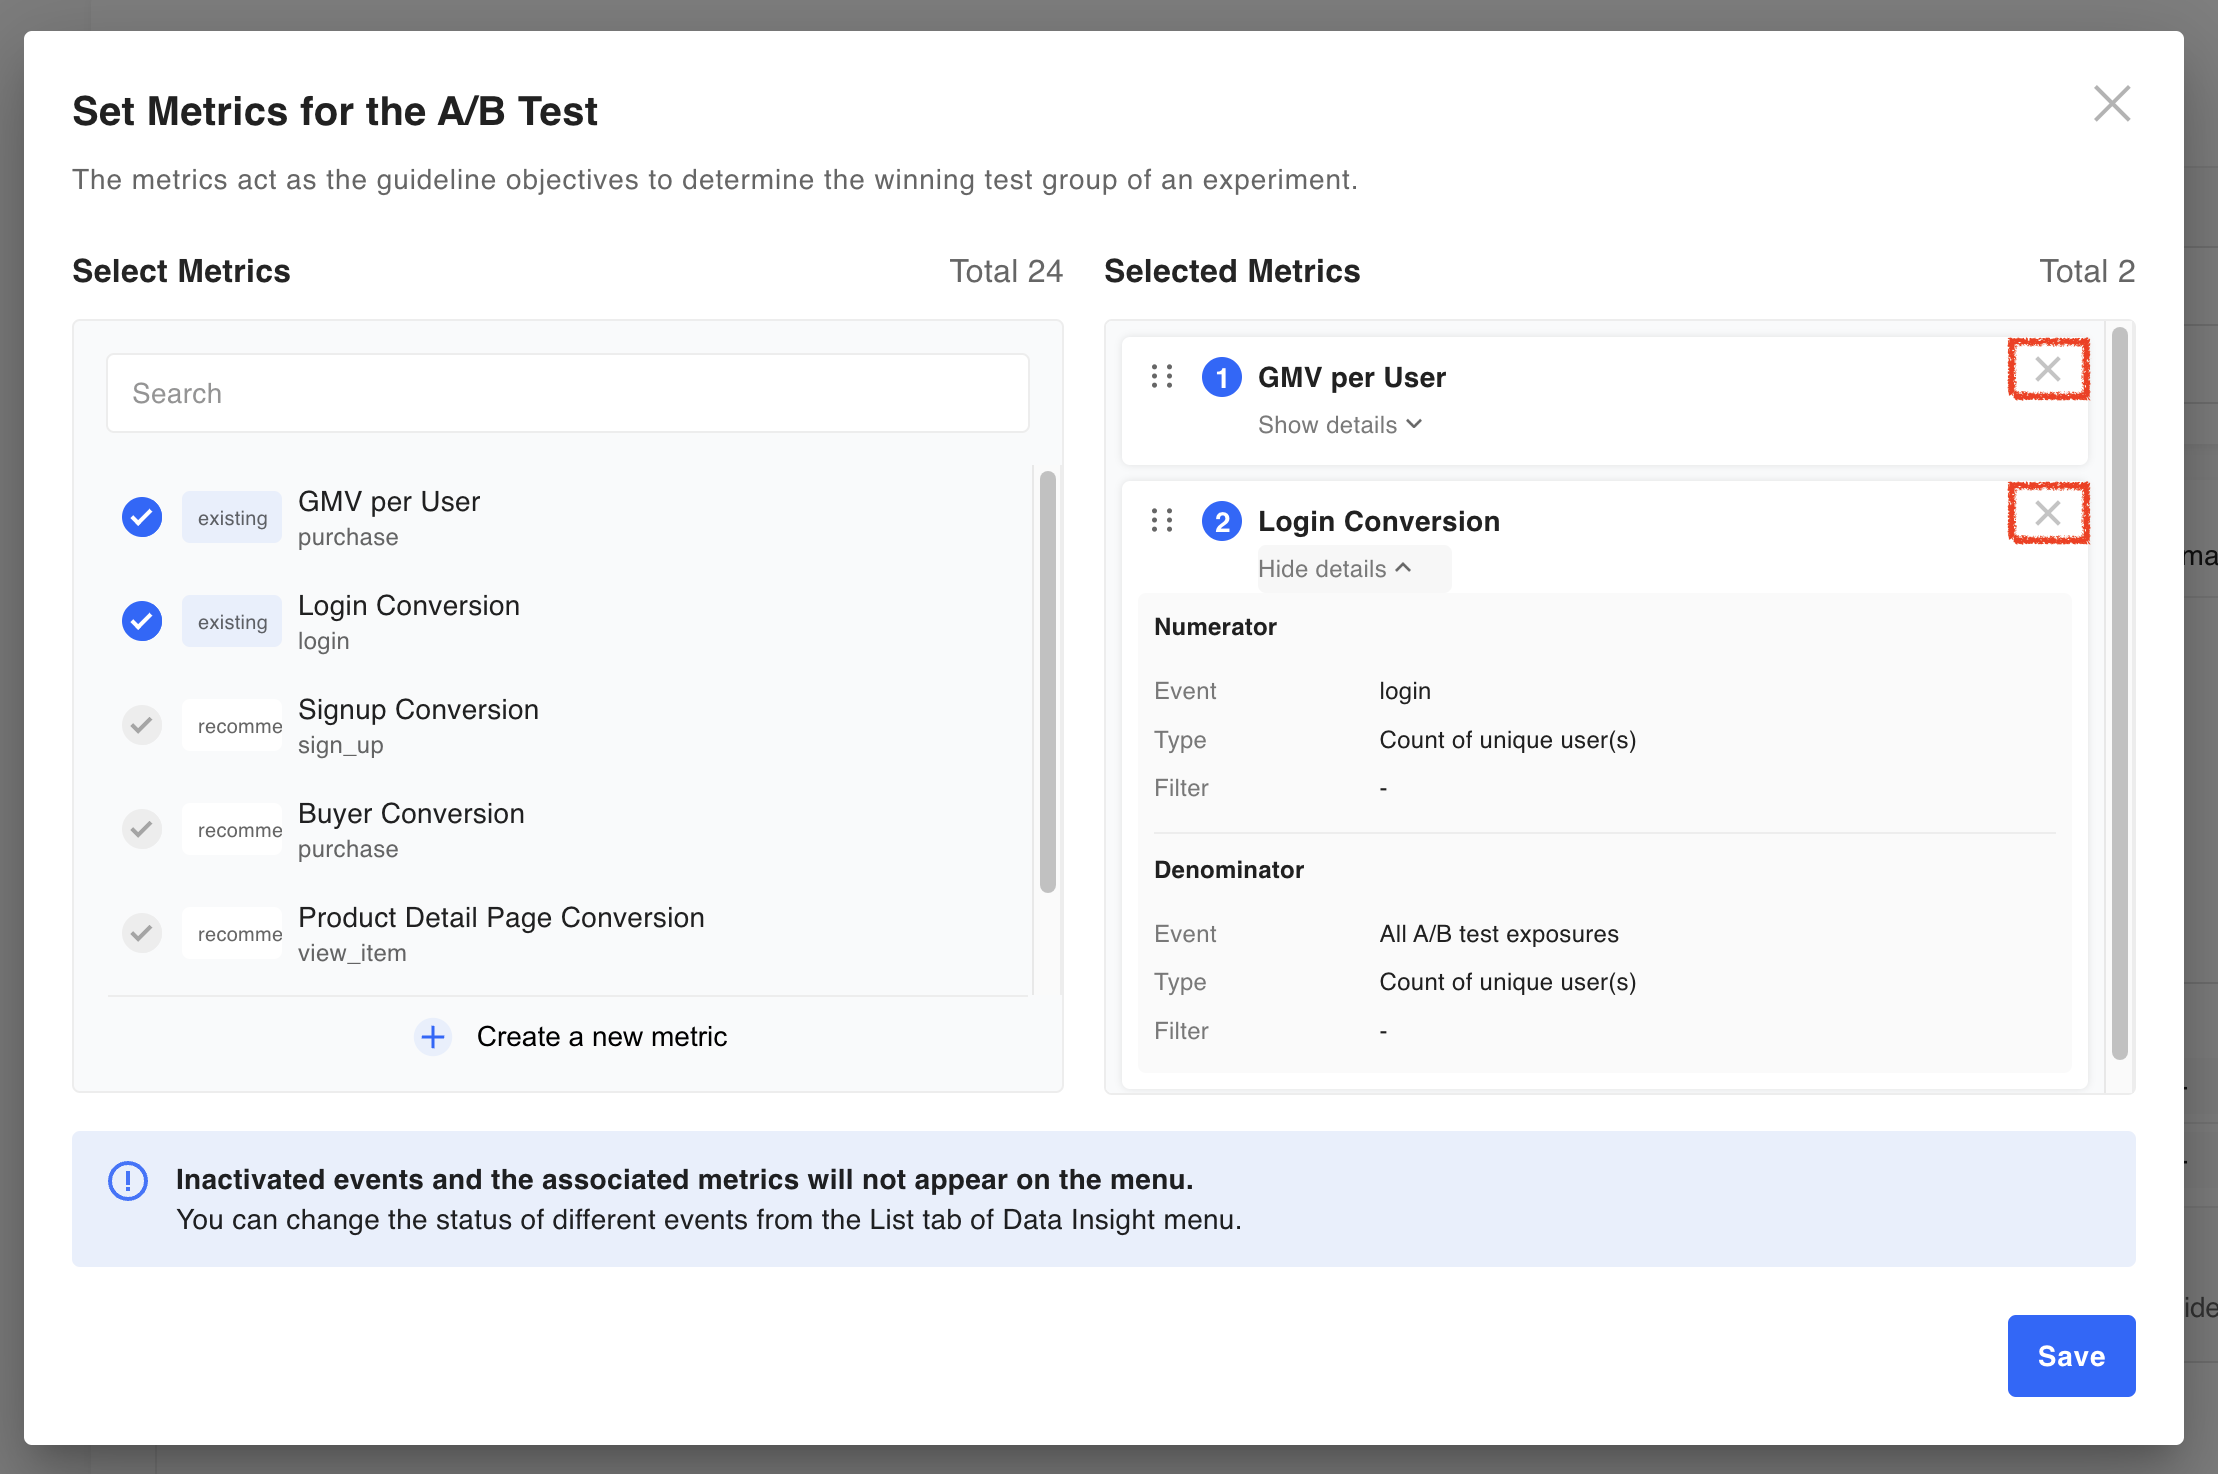
If you press the Set Metrics button, you will be guided to a pop-up image below.

You can easily re-use metrics set from other A/B tests from the left list. There are sample metrics that you can refer to. Please be aware that sample metrics will not be calculated.
If you are unable to find your desired metric from the existing metric list, you can create a new metric by clicking the Create a new metric button.
You must select at least one metric, but you can also select multiple at a time for a single experiment. Your selected metrics will be reflected on the right menu underneath “Selected Metrics”.

When several metrics are selected
The added metrics can be used in different types depending on the purpose. You can change the order and metric type to the icon located next to the metric name.
- Success Metric: This is the key metric, which determines whether an A/B test is successful or not.
- Guardrail Metric: This is the key metric, which should be observed in any A/B test to ensure that there is no negative impact on the overall business.
- Others: These are secondary metrics that you want to monitor through an A/B test.
Once all your metrics are selected, press the Save button to complete the setup.
After the metric setting is complete, the selected metric(s) will be reflected on the Metrics tab on the A/B Test Details page.
Create a new metric (creating your own metric calculation logic)
When you click the Create a new metric button, the following dialog will appear.
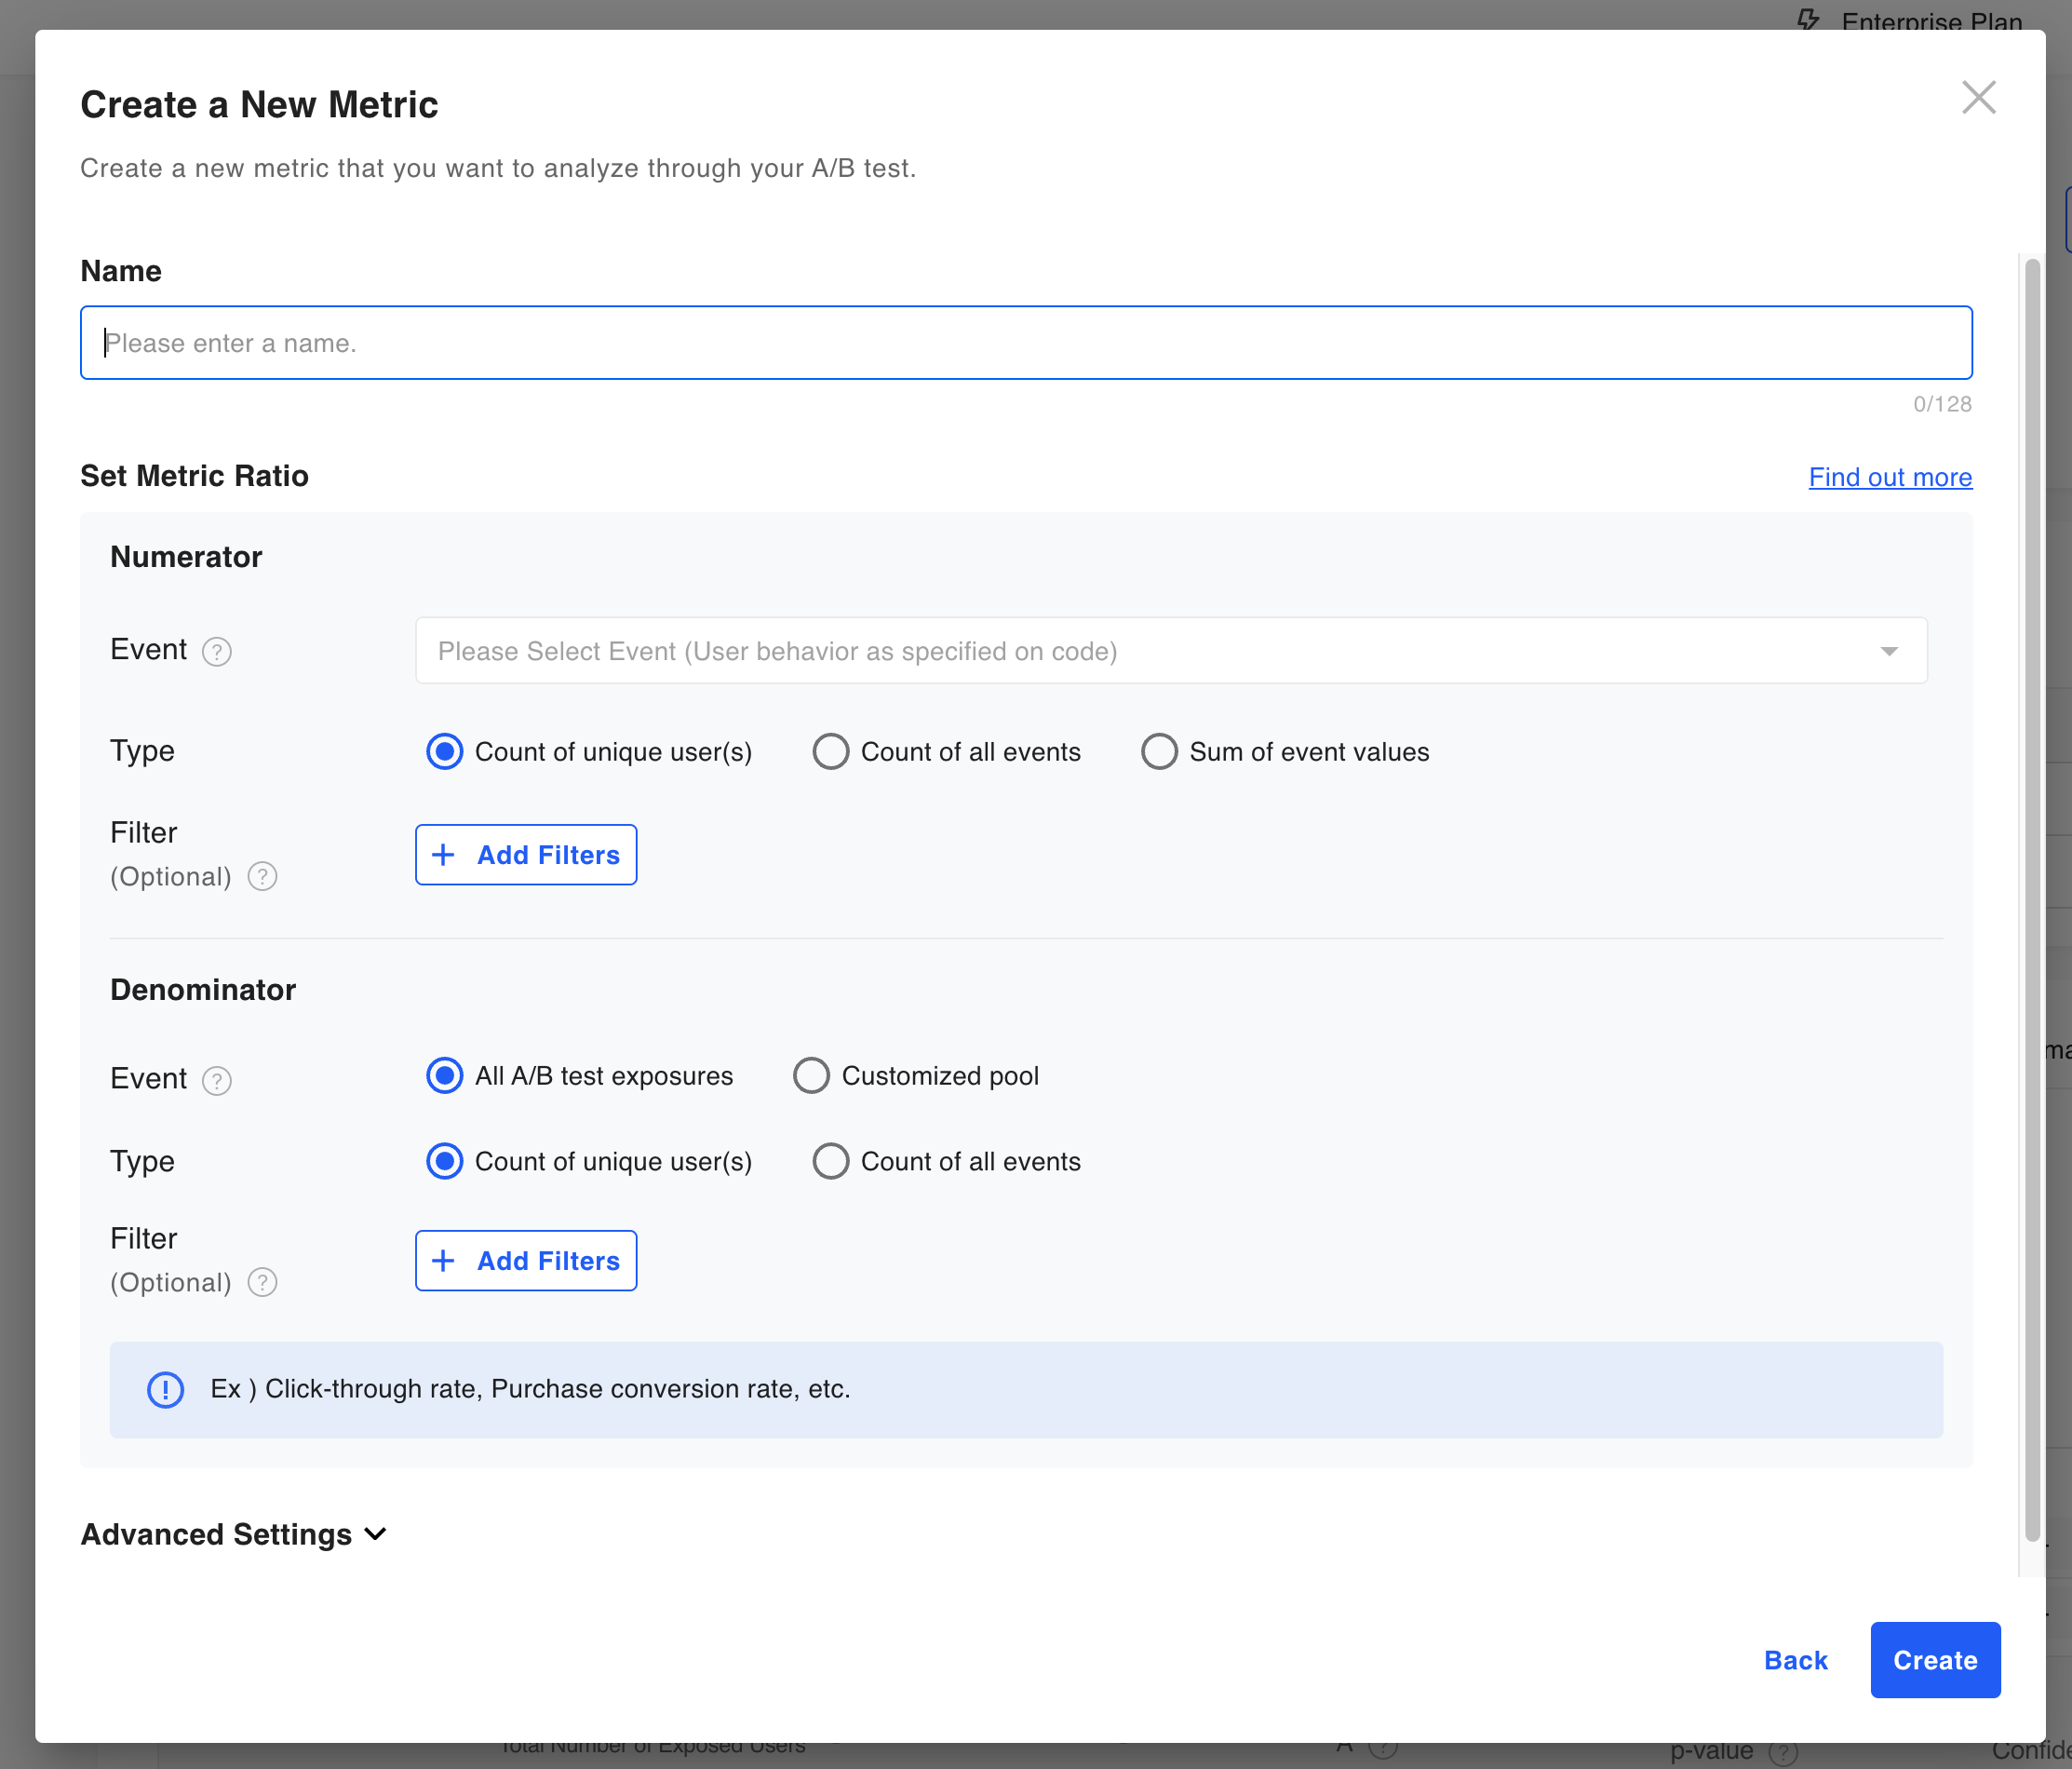
Create a new metric
Step 1. Enter a metric name
Enter a name for the metric. (Maximum length limit: 50 characters.)
Step 2. Configure the metric ratio settings
On the Hackle dashboard, metrics for the experiment are ratios with a numerator and denominator value. Select the appropriate events to calculate the metric ratio.
Events for both the numerator and denominator can either be selected or newly created.
Through a metric ratio provided by Hackle, you will be able to set which data to analyze for which pool of people.
In other words, 'what kind of users or the specific pool of users to target in your metrics' will be set as the denominator, and 'the type of data to analyze' will be set as the numerator.
Set the numerator of the metric ratio
Select the desired event that corresponds to the metric.
Events can be selected from the pre-existing ones or created new.
If you need help creating a new event, check out the Create Events document.
Set the denominator of the metric ratio (experiment population of the metric)
By default, you have two options for the denominator value.
-
All A/B test exposures (both total counts of A/B test exposures and total counts of unique users.) It refers to all users exposed to the A/B test. If A/B test exposure occurs at a specific page entry point, set the denominator as the total exposure, not the specific pool with the page entry event.
-
Denominator values narrowed to a specific pool of users that meet certain conditions/properties/actions. These conditions are primarily based on specific events after the A/B test exposure. For example, if you set the denominator event as 'login', it means that only the user who triggered the 'login' event among all test subjects will be counted as the denominator for the metrics calculation.
However, in order to set it based on a specific event, you must be using a paid plan with a pro plan or higher.
Why do we need events to calculate metrics?Let's say, for example, a company is considering changing the color of a Purchase button on their website. To see if the change will lead to better results, they created an A/B test, and set two metrics: 'purchase button clicks' and 'purchase conversion rate'.
- In order to calculate the 'purchase button clicks', or the total number of times the user clicked the button must be collected. Therefore, we create an event called 'clicking the purchase button' and count the number of times this event occurs.
- To calculate the 'purchase conversion rate', we need to find out how many times a user completes a purchase. So we create a 'purchase completed' event and collect the number of times buyers complete the purchase
As such, it is important to know how many events associated with the metric have occurred in order to determine whether the metric has been achieved.
How does the entered event integrate with the actual code?
Selecting an event automatically collected via SDK integration
In this case, since you have selected an event that already exists in the code, data calculation is possible automatically.Selecting an event entered manually from the dashboard
In this case, since you have selected an event that is not in the code, you need to start the experiment after planting the event in the desired location in the code to enable smooth data collection and calculation.
Step 2-1 When calculating from all A/B test exposures set as the experiment population (denominator)
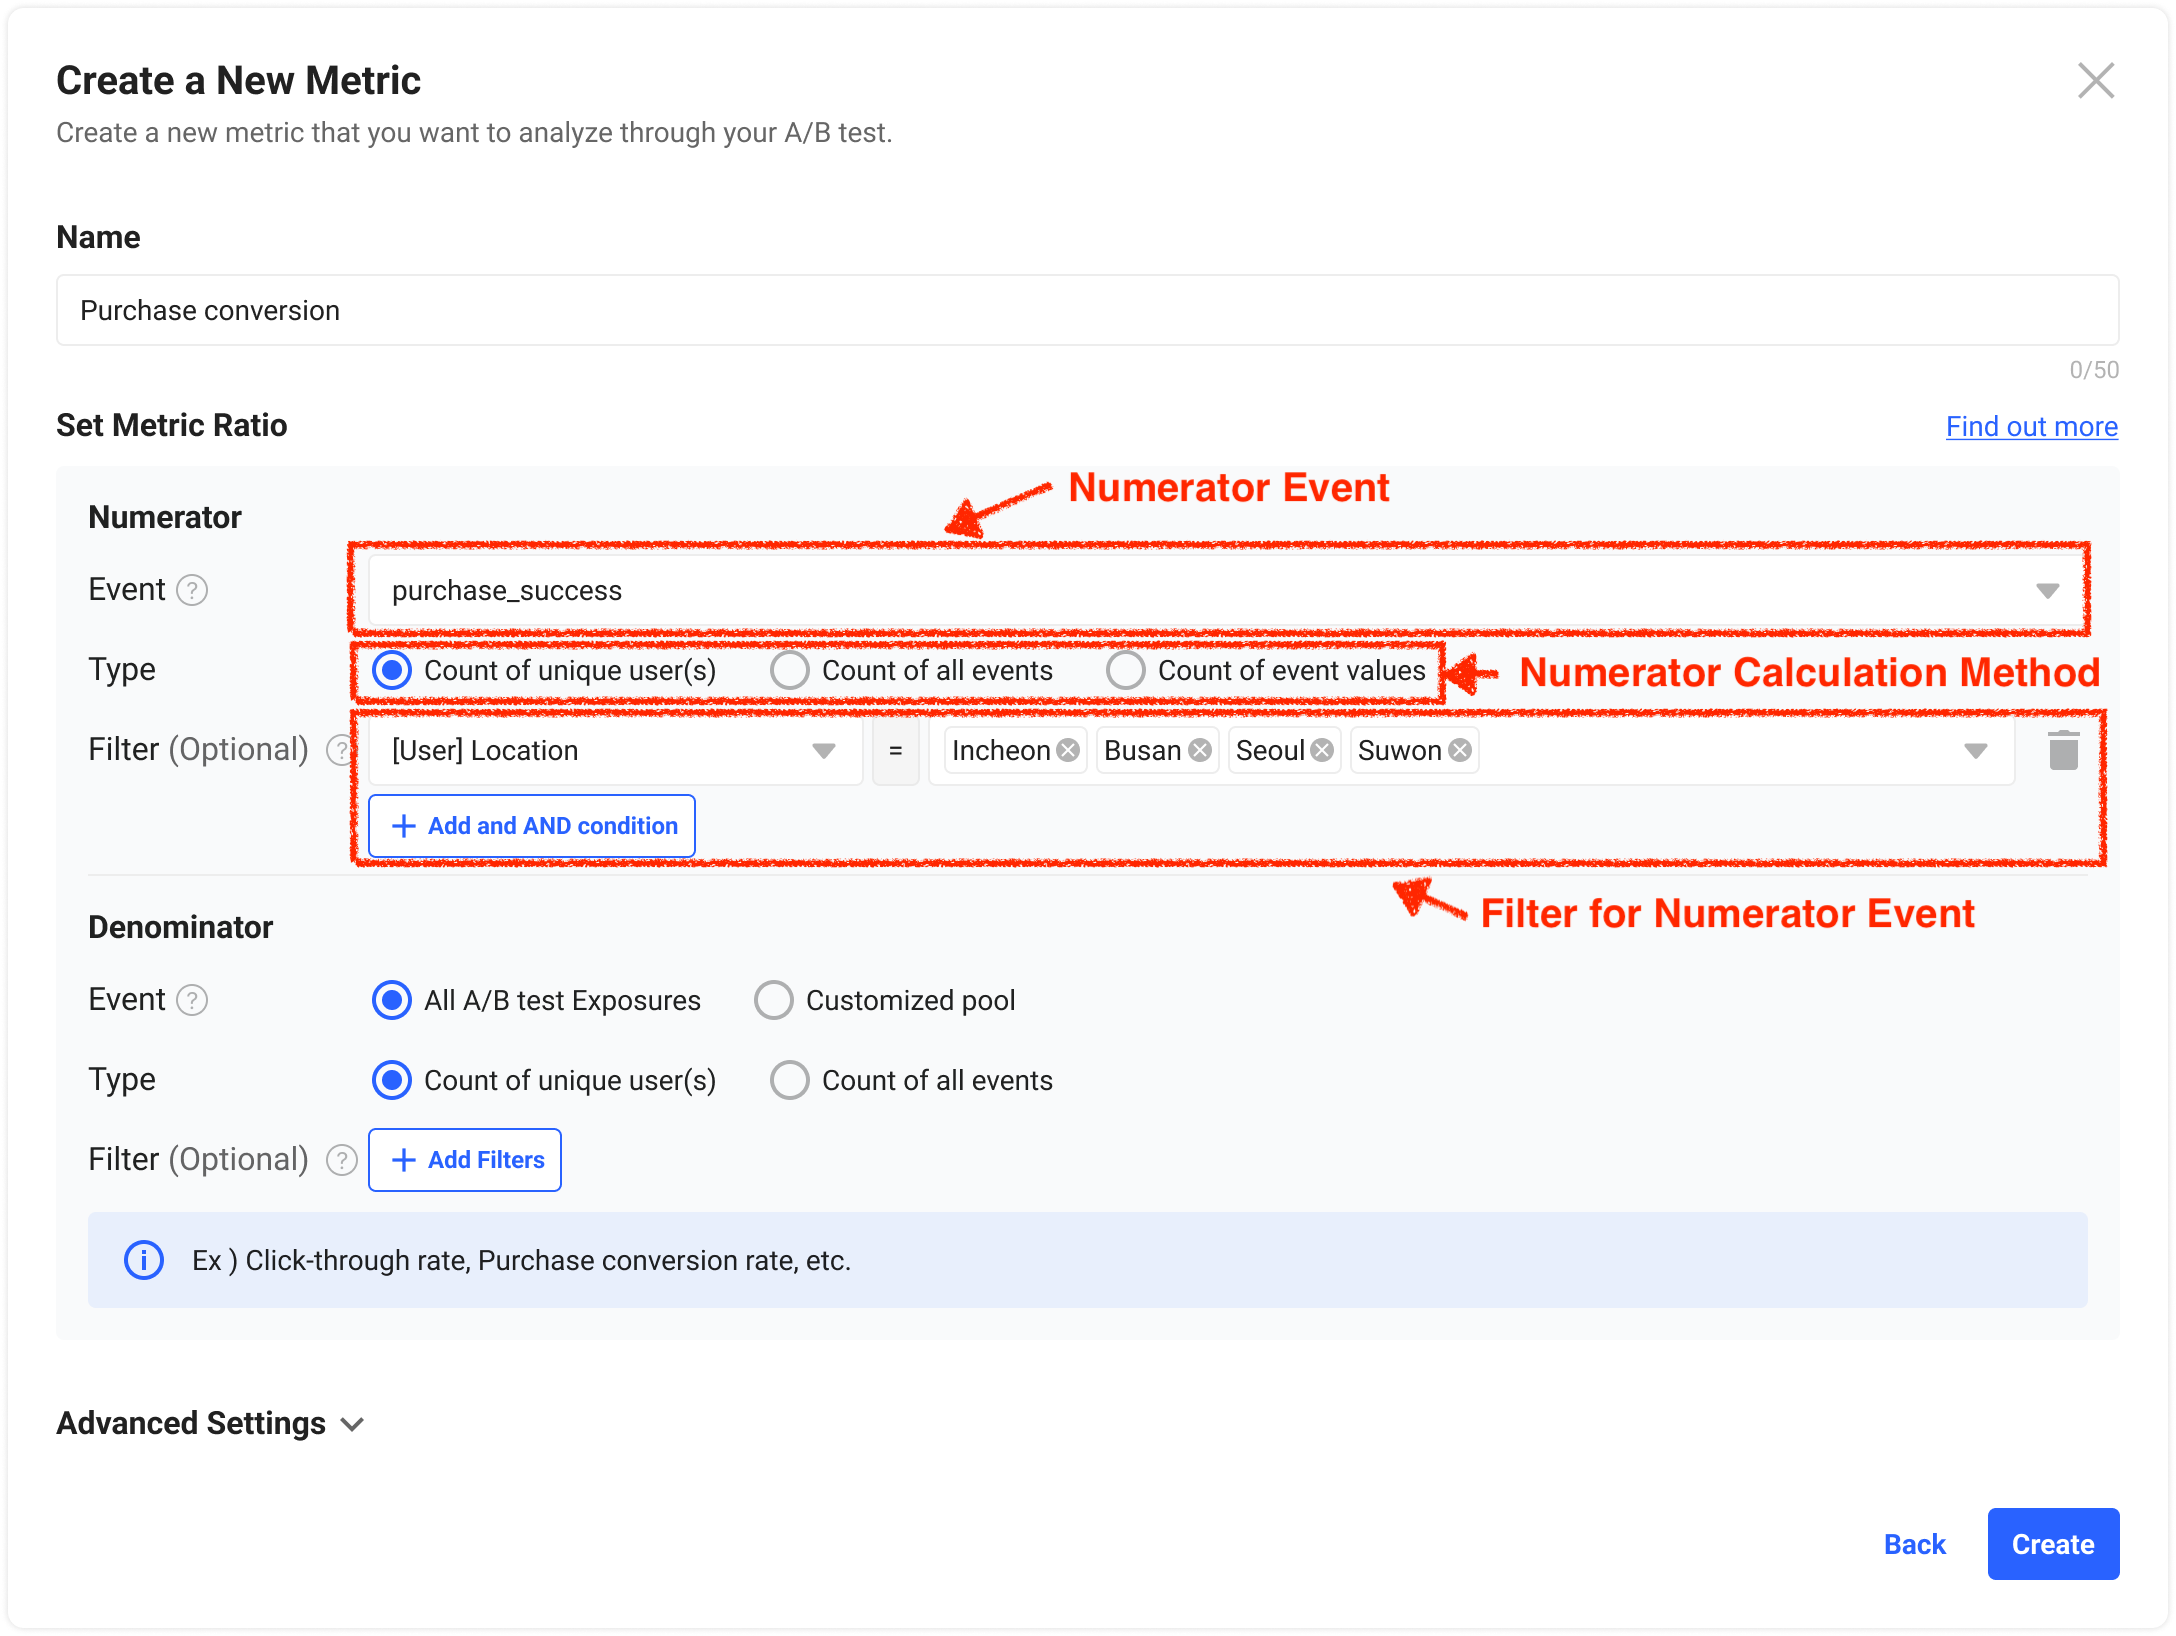
Select metric type
The Filter option helps you to set more detailed metrics by using specific attributes or properties of users or events.
For example, in an A/B test conducted on a specific category page such as fashion, there may be a need to measure the 'purchase conversion rate of a specific fashion item', and in this situation, you can set the desired metric using a filter.
In the first column of the filter, select the desired user or event property, and in the second column, select the desired value of the selected property. You can add up to 5 filters as AND condition.
If you need to understand properties, please refer to the Introduction to Properties document.
There are three main calculation types for processing the data collected from events for the numerator of the metrics.
Unique Users: Calculates how many unique visitors or users were exposed to A/B testing or triggered a selected event.
Count: Calculates the total number of times the selected event was fired. (Note: this could also include events like exposure to a certain page in order to measure the total number of exposures as opposed to unique users visiting a page).
Value: Calculates the average of the values generated by the selected event.
When Calculate from all A/B test exposures is selected as the denominator, five different metric calculation combinations can be set.
Numerator | Denominator | Explanation | Case Scenario |
|---|---|---|---|
(# of) Unique User(s) | (# of) Unique User(s) | Number of unique users who triggered the selected event out of the total number of unique users exposed to the A/B test. | Click-through rate, purchase conversion rate, banner click-through rate |
(# of) Unique User(s) | (# of) Unique User(s) | Average number of event triggers per visitor. Total number of times an event is triggered divided by total number of unique users exposed to the A/B test. | Average button clicks per user, Average number of purchases per user |
Value | (# of) Unique User(s) | Average event value per user. Total value from triggered events divided by the total number of unique users exposed to the A/B test. | Purchase value/amount per user |
Value | Count (of unique exposures) | Average event value per exposure. Total value from triggered events divided by the total number of exposures. | Total loading time for product page / the total number of exposures |
Count | Count (of unique exposures) | Number of times an event was triggered out of the total number of exposures. | The number product item clicks / the total number of exposures |
Step 2.2 When calculating from a customized pool (denominator)
Please check your planIn order to create a metric based on a customized denominator, you must use a paid plan (Pro plan or higher).
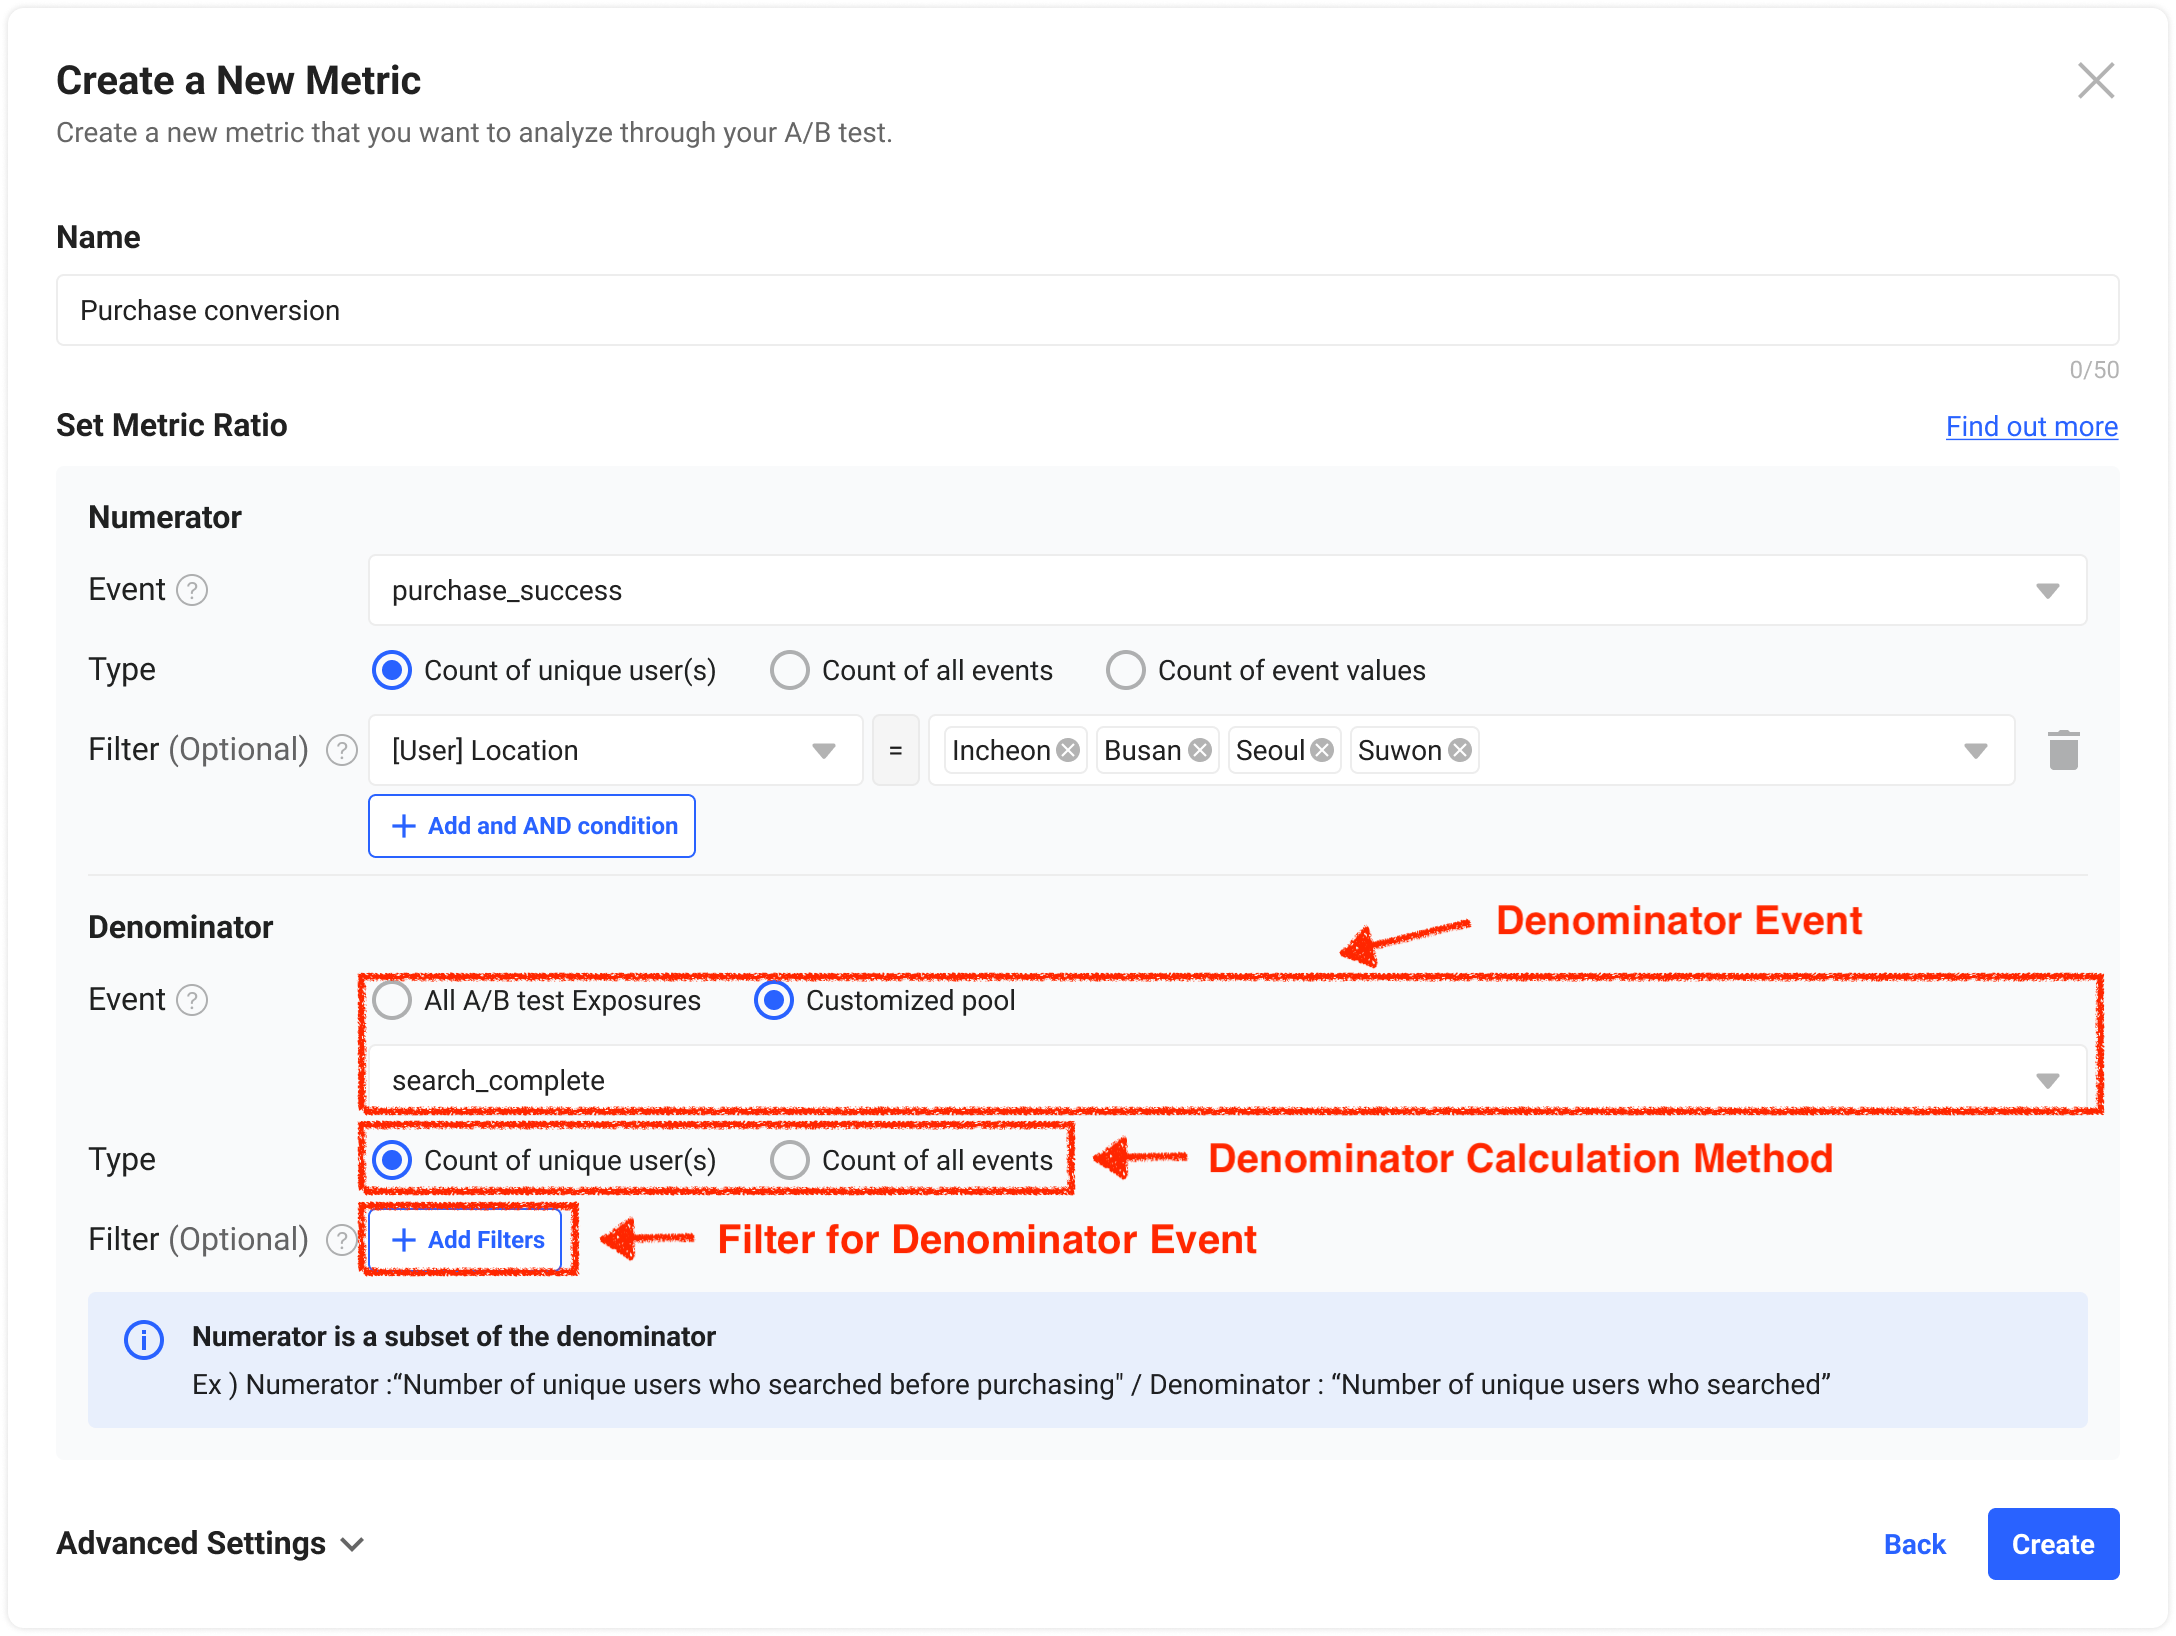
If you choose to calculate your metric from a customized denominator rather than all A/B test exposures, you will need to also set the specific event and calculation type for the denominator portion of the metric. Additionally, you can also set a Filter to further set specific properties for your customized denominator.
There are two main calculation types for processing the data collected from events for the denominator of the metrics.
Unique Users: Calculates how many unique users or visitors were exposed to A/B testing or triggered a selected event.
Count: Calculates the total number of times the selected event was fired.
The numerator for this type of customizable metric is dependent on the denominatorOnly events that a user triggers in the denominator will be calculated for the numerator value. Meaning when 'customized pool' is selected for the denominator, unique users exposed to the A/B test who triggered the specified event from the denominator and then subsequently triggered the specified event from the numerator will be reflected in the metric calculations.
When customized pool is selected as the denominator for calculating the metric, there are four main types of metric calculations that can be set.
Numerator | Denominator | Explanation | Case Scenario |
|---|---|---|---|
(# of) Unique User(s) | (# of) Unique User(s) (who triggered a specified event) | of unique users who triggered numerator event after denominator event / # of unique users who triggered denominator event. (Numerator is a subset of the denominator) | Purchase conversion rate of users who added items to cart, button click rate compared to landing page entry (number of users who completed purchase/ number of users who viewed the product page) |
Value | (# of) Unique User(s) (who triggered a specified event) | Average event value per specified user. Total value from triggered numerator event / # of unique users who triggered the denominator event. (Numerator is a subset of the denominator) | Purchase amount per user |
Count | Count (of the number of times a specific event was triggered) | Number of the numerator event triggers following denominator triggers out of the total number of denominator triggers. | Search result click conversion rate compared to search attempts (Number of clicks on search results / number of searches) |
Value | Count (of the number of times a specific event was triggered) | Average value per event trigger. Total value generated from the numerator event / # of triggers from the denominator event. (Numerator is a subset of the denominator) | AOV |
Step 3. Select the indication of success for the metric
Similar to selecting a metric type, you can select this by clicking on Advanced Settings.

Select the success criteria for the metric
Metric success is selected to distinguish the winning test group based on the data processed depending on each metric. For example, for the purchase amount, the higher the better, and for returning items, the lower the count the better.
Examples of when increasing compared to Test Group A is better: Higher values are better
** Example metrics: purchase conversion rate, search count, subscriber count, etc.
Examples of when decreasing compared to Test Group A is better: Lower values are better
** Example metrics: number of cancellations, page loading time, etc.
Delete Metrics
If you don't need to collect data for a particular metric, or if you want to delete an incorrect metric from the list of Selected Metrics for your experiment, you can click the trash icon to the right of the metric name you set. Press save.
However, just like setting a metric, deleting a metric from your experiment is only possible before you start your A/B test.
Delete metric(s)
Updated 8 months ago