Analyze performance of a Push Message
Utilize Hackle's powerful data analytics capabilities to deeply measure your campaign performance.
Step 1. Select Campaign
In the Push Message menu of the dashboard, select the campaign you want to check the performance for.
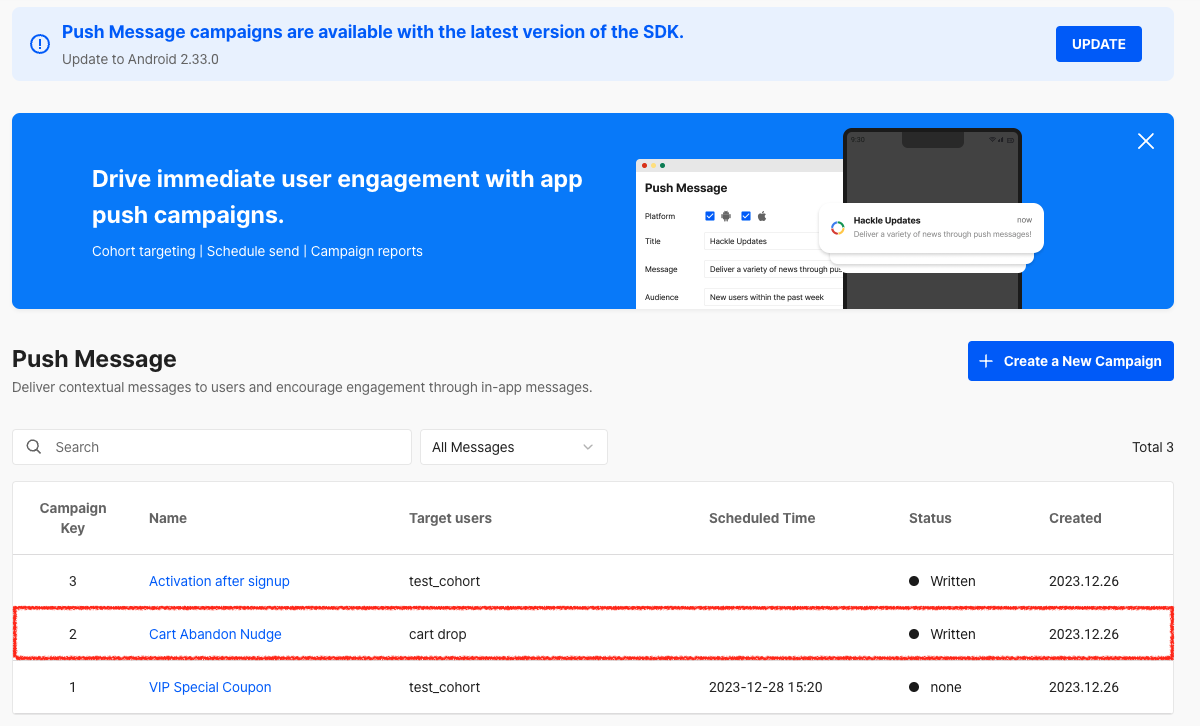
Select Push Message Campaign
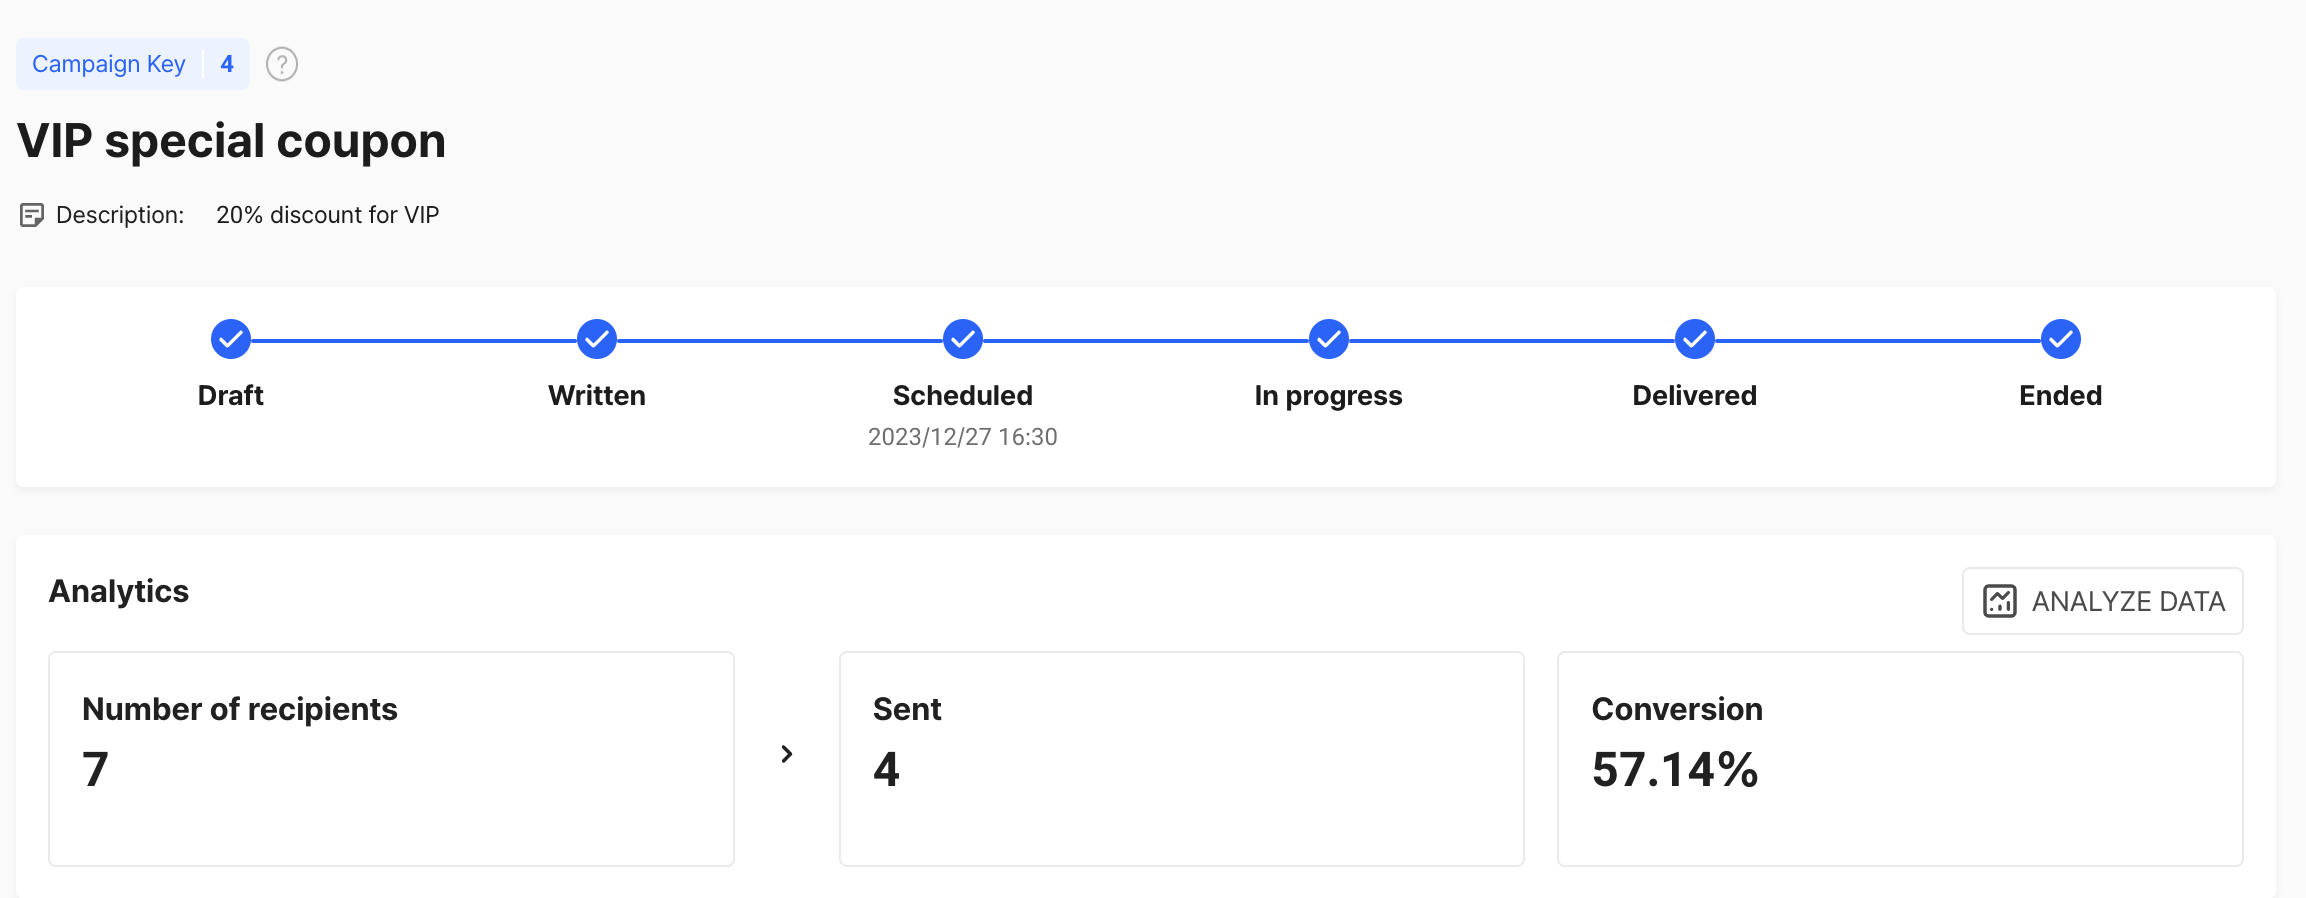
Step 2. Check Summary Statistics
For campaigns with a delivery history, you can check basic statistics right away at the top.
You can see the number of recipient devices, delivery success rate, and click-through rate at a glance.
Click the Analyze Performance in Detail button in the top right corner to go to the screen where you can analyze the performance data for that campaign.
Analyze Data
Step 3. Detailed Performance Analysis
You can easily analyze the delivery and click events for the selected campaign using funnel analysis.
Step 3-1. Basic Settings
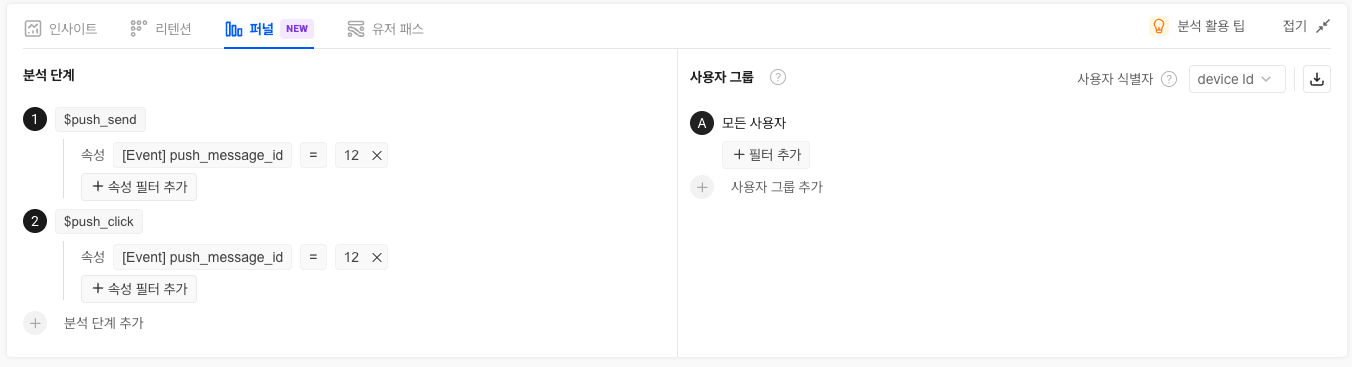
Default Analysis Conditions
The meaning of each event is as follows:
- (1) Number of Deliveries (UV): $push_send
- (2) Number of Clicks (UV): $push_click
- The identifier criterion is the same as the cohort set as the target (device_id or user_id).
- The query period is the same as the campaign delivery period.
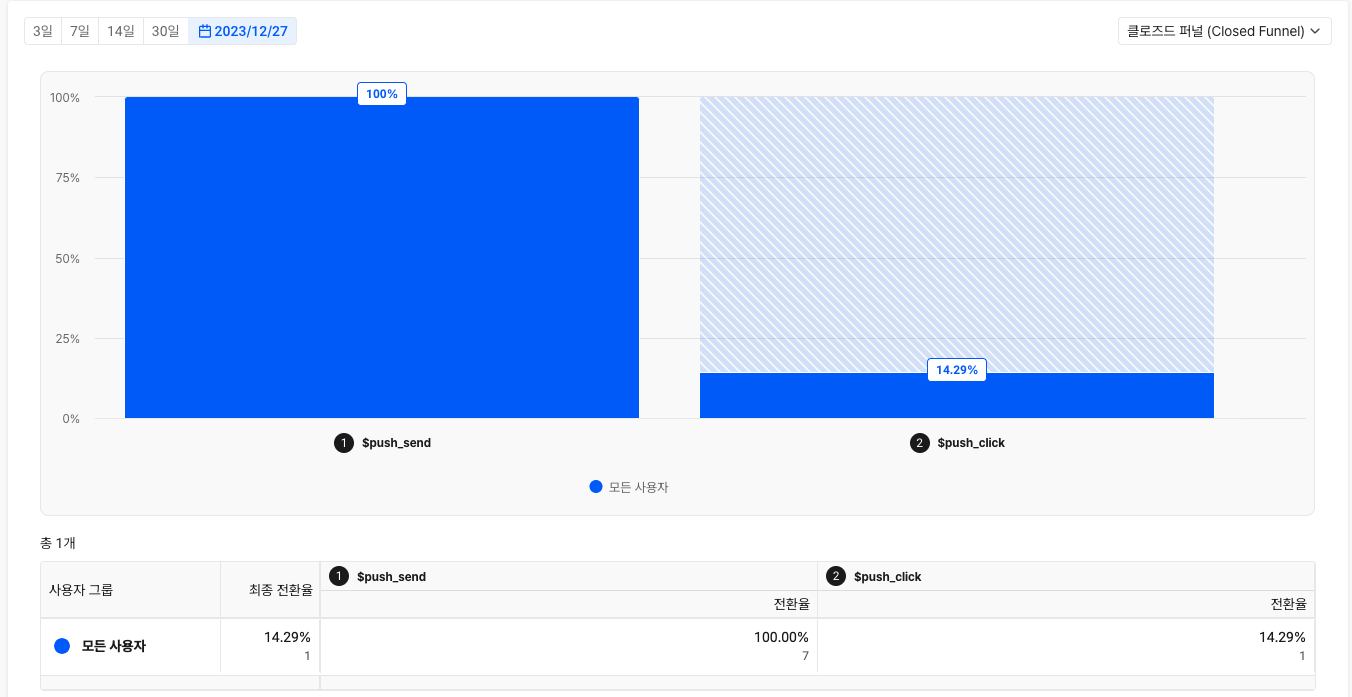
View Results
Step 3-1. Additional Analysis
If you want to know the conversion rate after clicking the push message?
Select the desired event (e.g., complete purchase, complete signup) in the analysis step, and you can immediately see the conversion rate that occurred after clicking the push message.
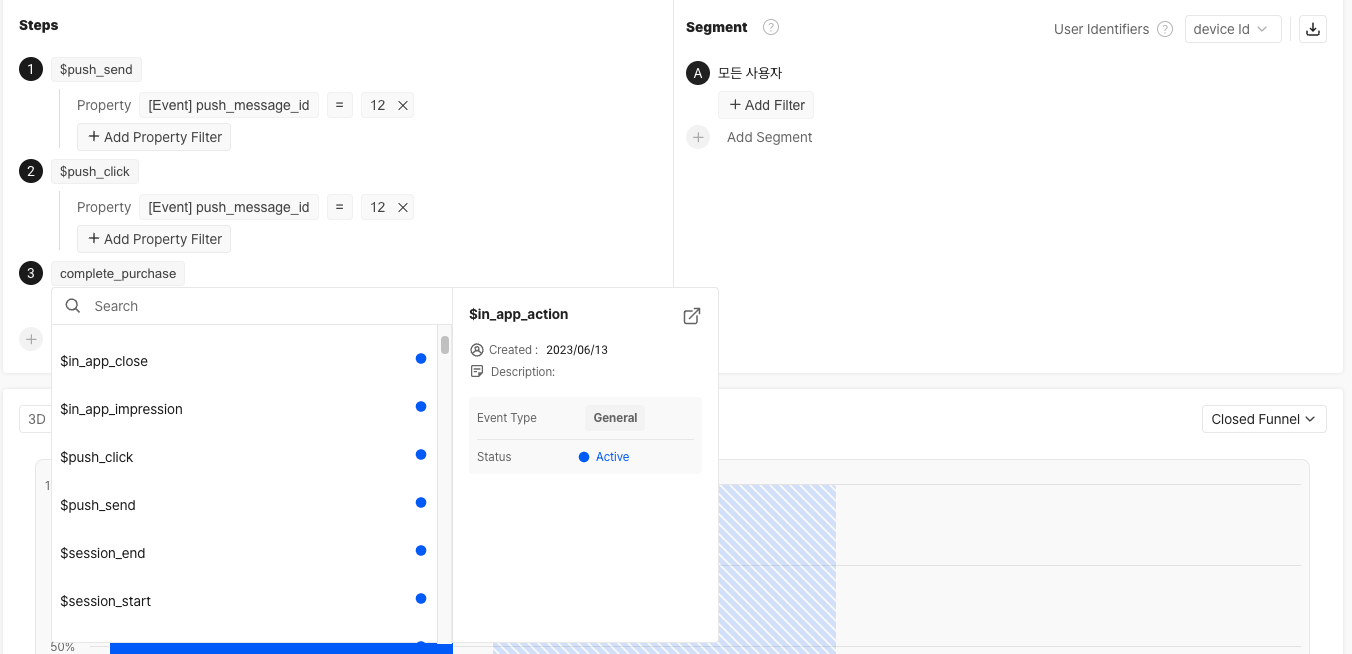
Add Analysis Step
If you need to compare user groups?
Set the desired user group (e.g., Android, iOS users) in the User Group on the right, and you can easily compare the conversion rates by user group.
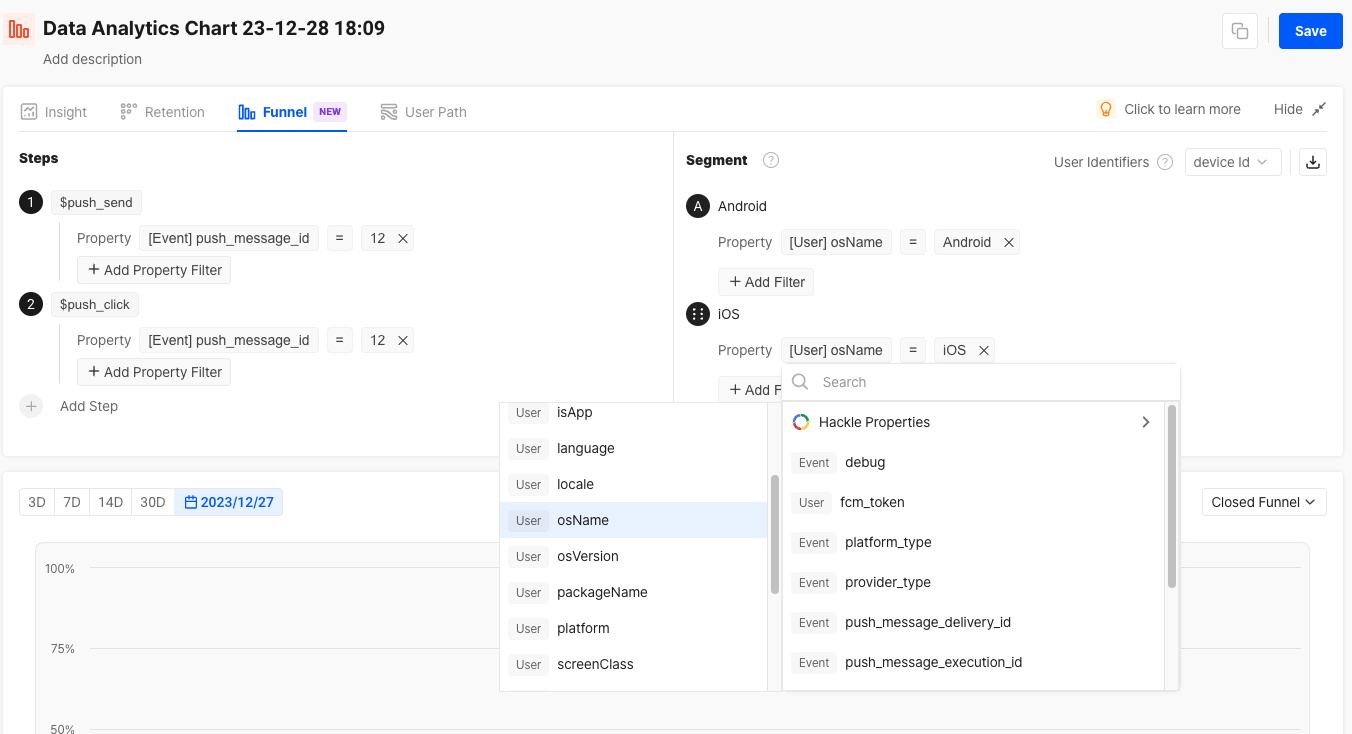
Compare Conversion Rates by User Group
Updated 8 months ago