Outliers
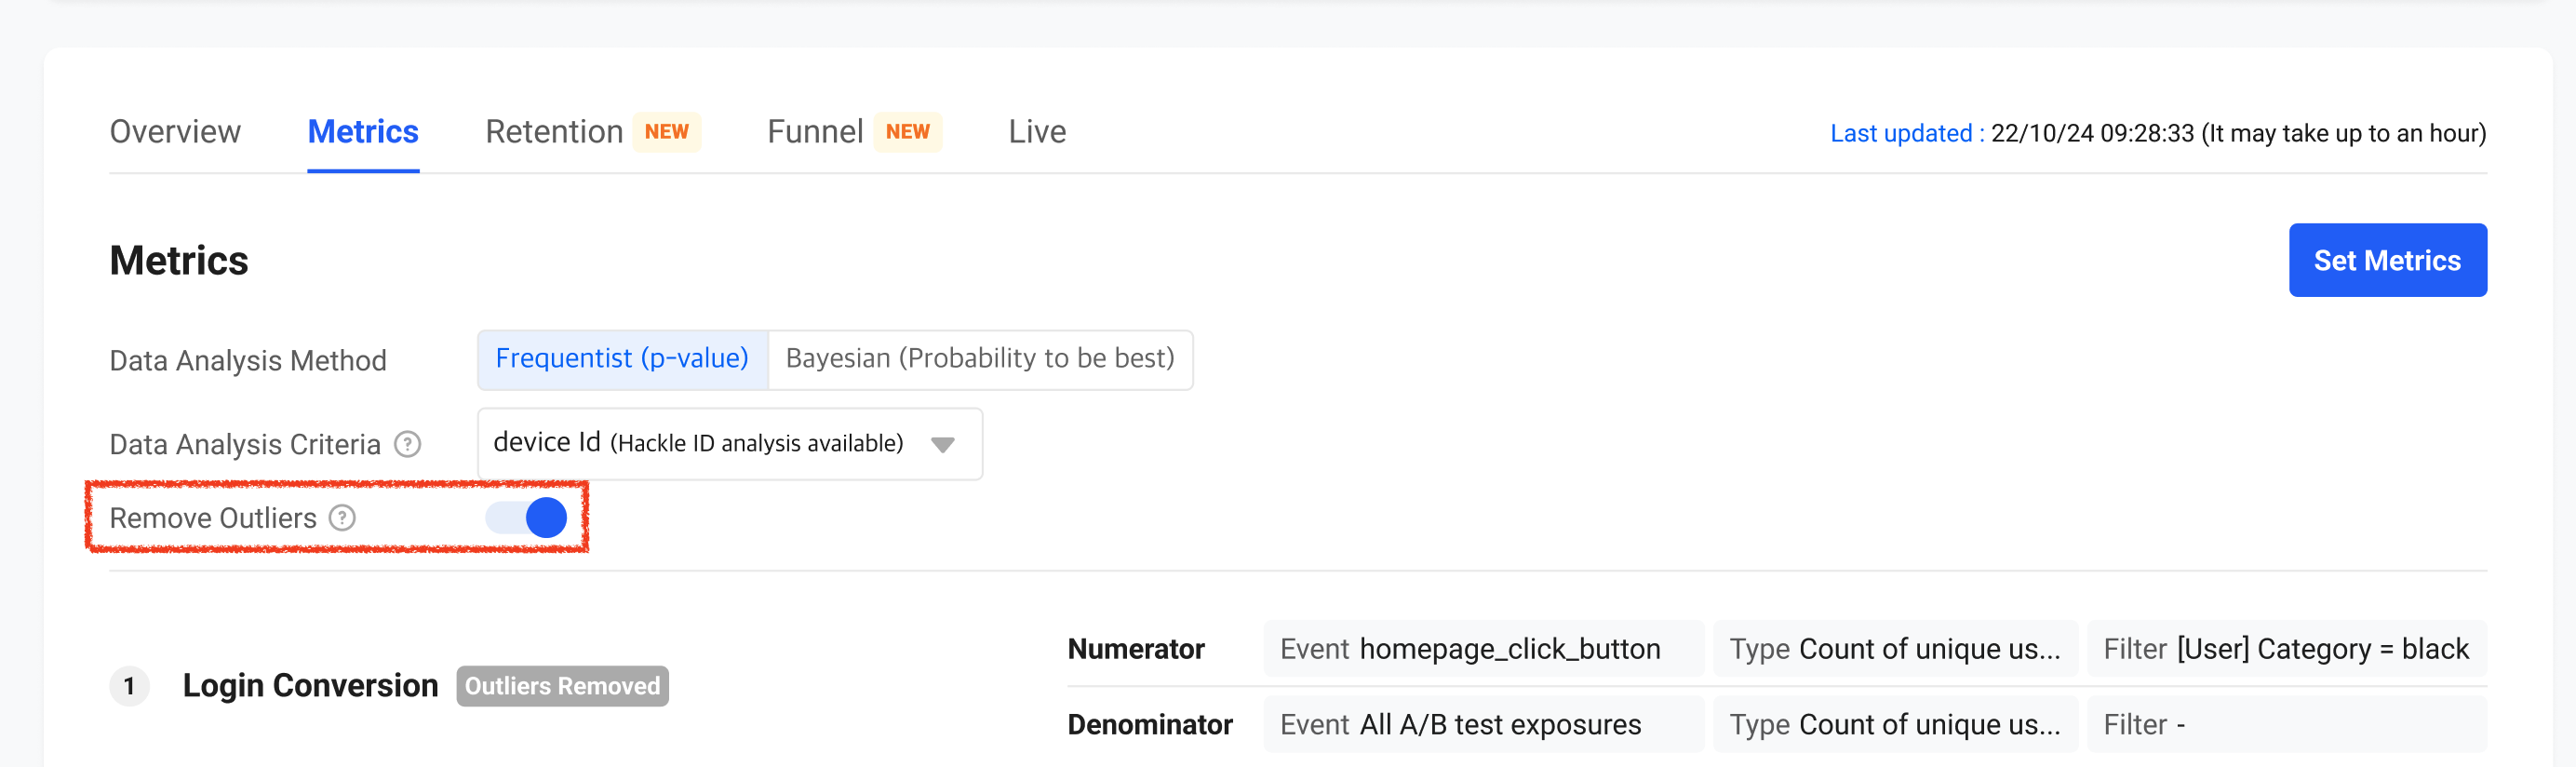
The option to exclude outliers from A/B test results is only available on the 'Metrics Tab' on the A/B test detail page.
About Outliers
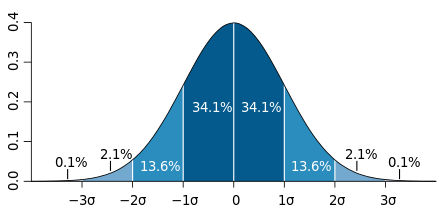
In statistics, an outlier is an observation that has an abnormally higher or lower value than other values in a set of observed data. An outlier can seriously skew the accuracy of the analysis results performed using the observed dataset and potentially lead to false conclusions. Because the values we use in metric analysis are mostly mean values. As is well known, Outliers could skew the mean.
For example, imagine an online shopping mall experimenting with improving the total amount of orders per visitor. The visitor usually spends an average of $100 per week at the shopping mall. What if some visitor places an order 100 times higher than the average ($10 million)? Including these extreme users in a particular group in the analysis of the experiment can skew comparisons between A/B groups, leading to incorrect conclusions in the test.
For this reason, Hackle provides the option to remove the data of outliers from the results of the experiment in the metrics Tab. Please be aware that it is only supported when the denominator of the metric is the count of a number or sum of values.
How to handle Outliers
When the remove outlier option is enabled, Hackle calculates the mean and standard deviation in the metric units set in the experiment, converting the aggregation results (X) of individual users used in the metric analysis to z-score (mean = 0, standard deviation = 1). If the result is greater than 3 or less than -3, we consider it as an outlier and excluded it from the aggregate.
z-score = ( X - mean ) / standard deviation
You can activate the remove outliers option as shown below when there are at least one metric supporting the function.
However, even if the metrics is to exclude the outlier, the result may unchanged when the source data itself does not have the extreme value.
When denominator is A/B test exposures, you can remove outliers for value or count type numerators as below.
Numerator | Denominator | Explanation | Case Scenario |
|---|---|---|---|
Value | (# of) Unique User(s) | Average event value per user. Total value from triggered events divided by the total number of unique users exposed to the A/B test. | Purchase value/amount per user |
Count | (# of) Unique User(s) | Number of times an event was triggered out of the total number of exposures. | The number product item clicks / the total number of exposures |
When denominator is customized pool, you can remove outliers for value or count type numerators as below.
| Numerator | Denominator | Explanation | Case Scenario |
|---|---|---|---|
| Value | (# of) Unique User(s) (who triggered a specified event) | Average event value per specified user. Total value from triggered numerator event / # of unique users who triggered the denominator event. (Numerator is a subset of the denominator) | Purchase amount per user |
| Count | (# of) Unique User(s) (who triggered a specified event) | Average event count per specified user. Total count from triggered numerator event / # of unique users who triggered the denominator event. (Numerator is a subset of the denominator) | Number of clicks on search results / number of searchers) |
Updated 8 months ago