Step 8-2 Interpret Funnel result
Once the A/B test is successfully implemented, traffic is assigned and the user is exposed to the A/B test, you can check the test results within up to one hour. It will be updated every hour and you can view data up to 30 days from the start of the A/B test.
Analyzing the funnel result
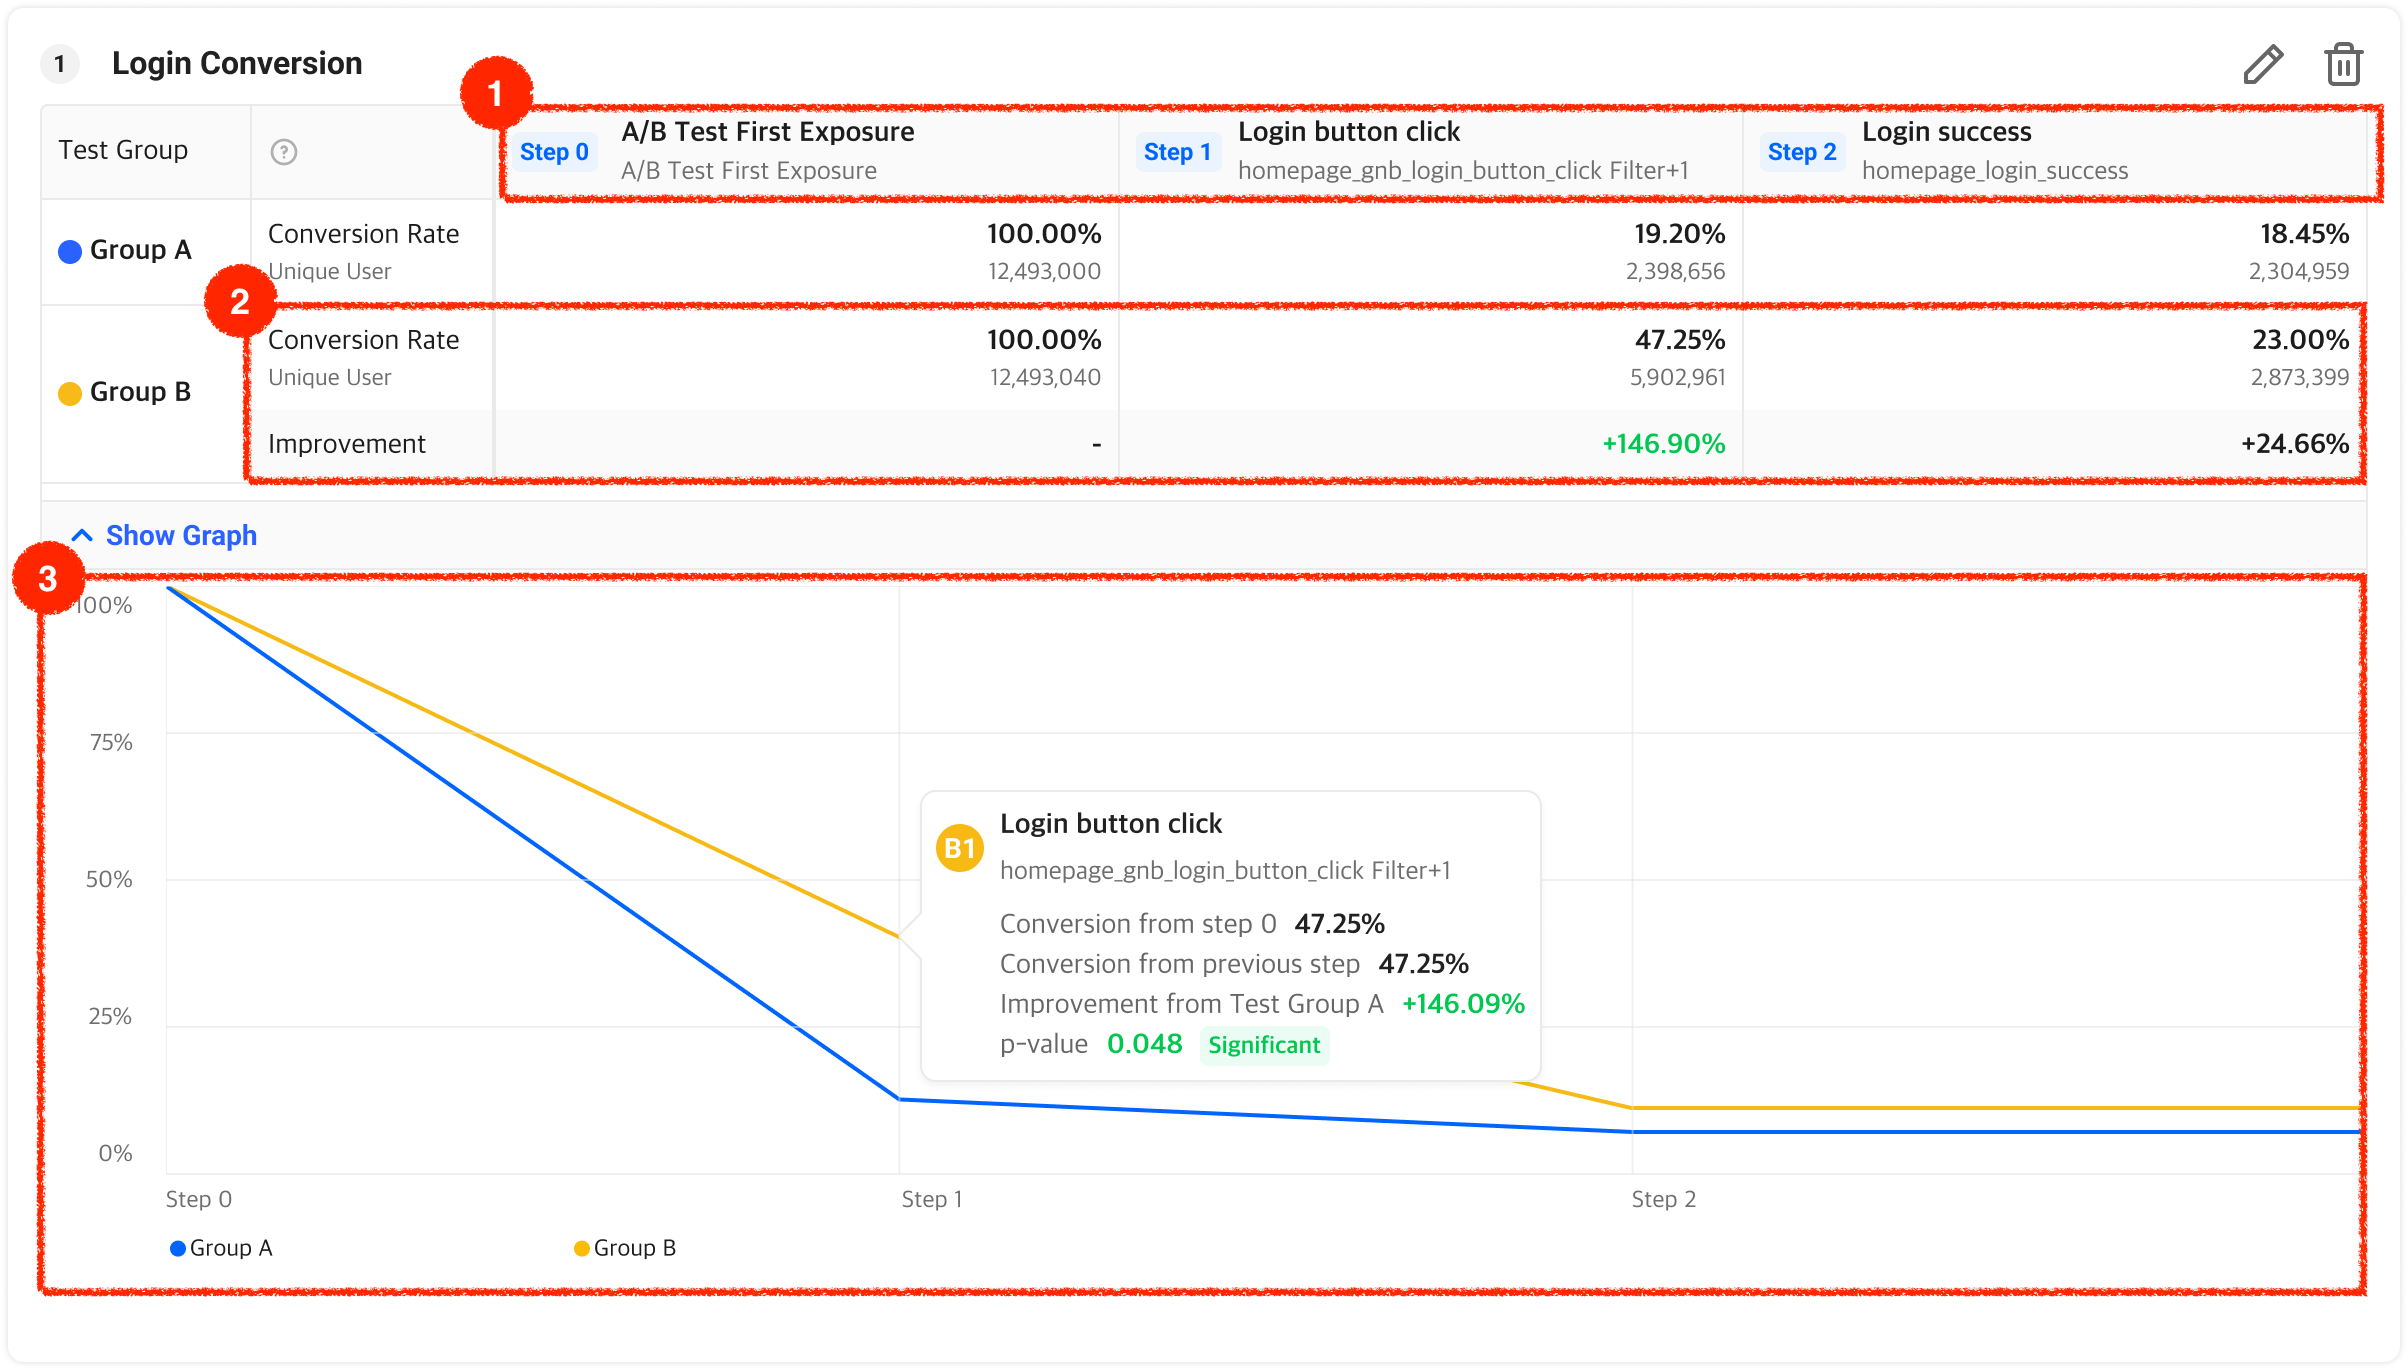
- Step : You can view the name of the step and the event, filter information. Please hover the mouse to each step for further details.
- Data Table : A table that shows number of users, conversion rate, improvement rate compared to Group A by each step and each group
2-1. Conversion : The percentage of users in that group who generated event for each step.
2-2. Number of User : The number of unique users who generated event for each stage
2-3. Improvement : The relative difference between the conversion rate for group A and that of each test group. Especially when the p-value is less than 0.05, the difference is considered as statistically significant and marked as in green. - Graph : A line chart that shows conversion rate by each step. Each line represent each test group.
3-1. Conversion rate from step 0 : The percentage of users that generated events for each step out of users in step 0.
3-2. Conversion rate from previous step : The percentage of users that generated events for each step out of users in previous step.
3-3. Improvement : The relative difference between the conversion rate for group A and that of each test group.
3-4. p-value : A value that expresses the reliability of the A/B test result. The lower the p-value, the more reliable the result is. Especially when the p-value is less than 0.05, the difference is considered as statistically significant and Significant badge will be added.
Updated 8 months ago